Kubernetes for the Cool Kids (Who Route Packets)
From a network engineer to network engineers. No bullshit.
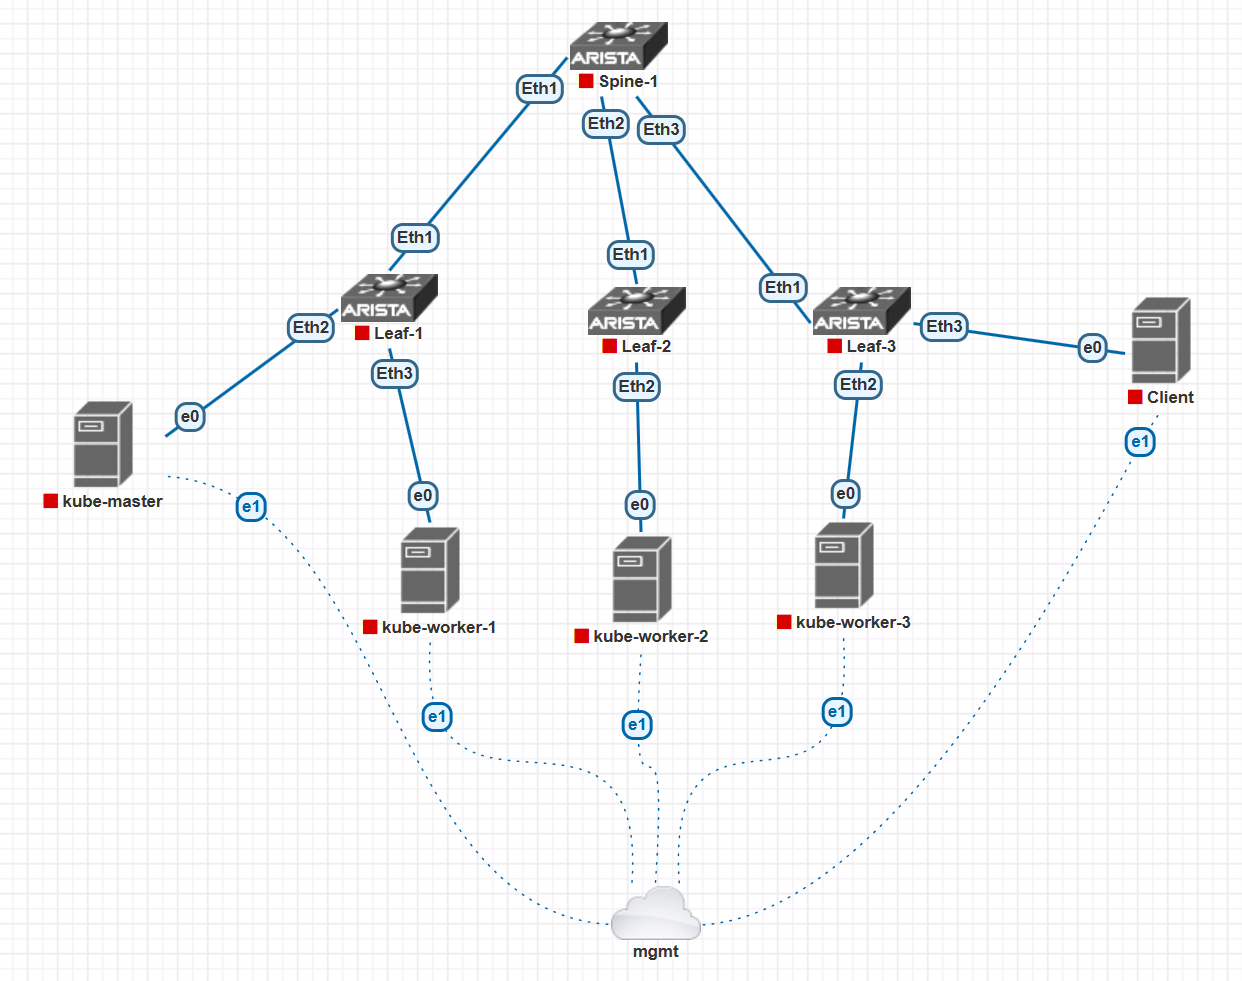
The Lab Setup
Alright, folks. We’re about to simulate a “baremetal” Kubernetes cluster. And by “baremetal,” I of course mean an Ubuntu VM running inside a hypervisor that’s itself virtualized. You get the idea. Here’s the master plan:
Now, because we’re doing this the right way:
We’ll emulate the whole thing right in PNETLAB.
We’re using a Leaf-Spine topology. Standard.
We’re all know that L2 is BAD and we’re skipping the VLAN nonsense. Pure L3, baby. Every link to the servers is a routed point-to-point. It’s the only sane way.
- We’ll fire up OSPF between the switches so all our servers can talk to each other. It’s gonna be smooth.
We’ll use some random Ubuntu (whatever was closest at hand, you know how it is):
root@K-Master:~# lsb_release -a
No LSB modules are available.
Distributor ID:	Ubuntu
Description:	Ubuntu 22.04.2 LTS
Release:	22.04
Codename:	jammy
Basic Network Setup
Let’s cook up some ridiculously convoluted addressing scheme, like this one, and make sure the nodes can ping each other:
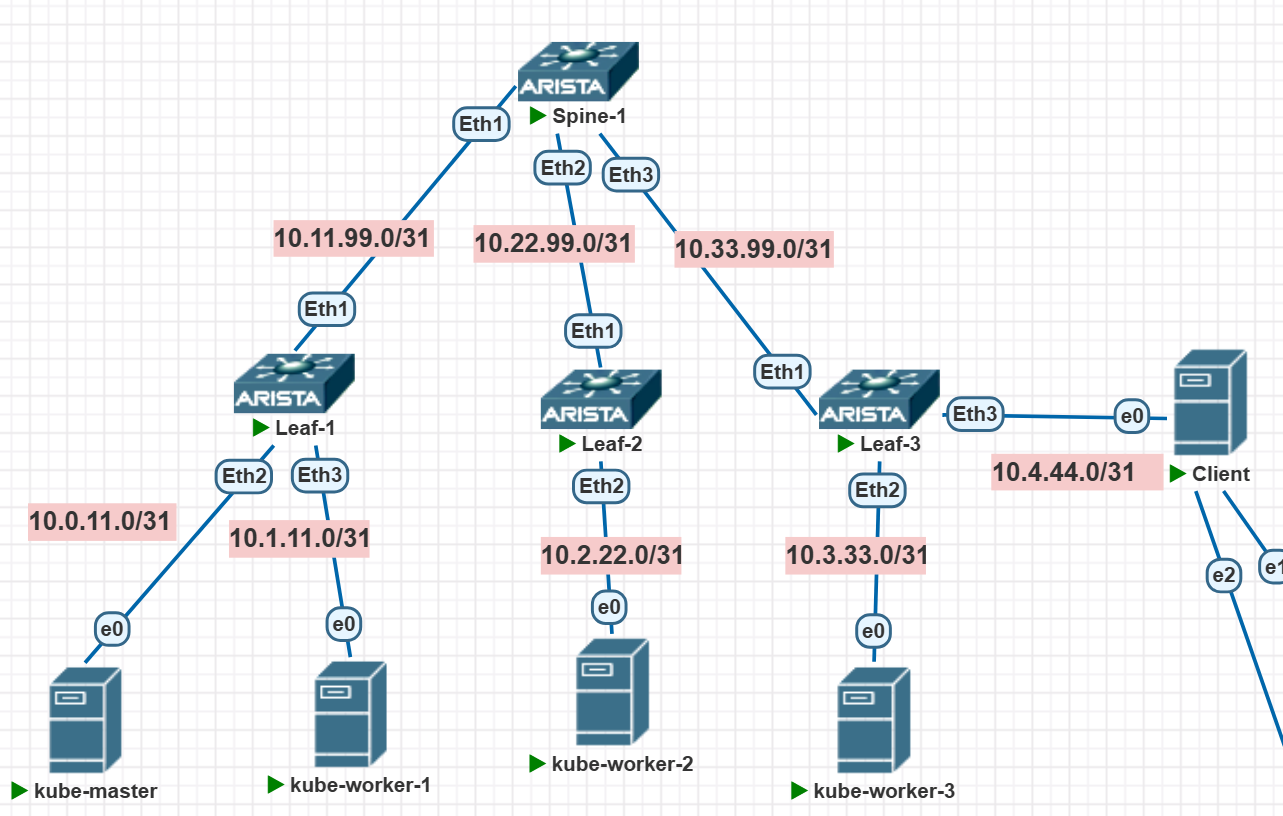
The “lower” device gets the first IP, the “upper” one gets the zero. Between the leafs and spines, we’ll set up a simple little OSPF. The leafs will be the default gateways for the servers.
On the first leaf, we do this:
interface Ethernet1
   no switchport
   ip address 10.11.99.1/31
!
interface Ethernet2
   no switchport
   ip address 10.0.11.0/31
!
interface Ethernet3
   no switchport
   ip address 10.1.11.0/31
On the kube master, we do this:
root@K-Master:~# ip addr add 10.0.11.1/31 dev ens3
# It pings!
root@K-Master:~# ping 10.0.11.0
PING 10.0.11.0 (10.0.11.0) 56(84) bytes of data.
64 bytes from 10.0.11.0: icmp_seq=1 ttl=64 time=32.3 ms
64 bytes from 10.0.11.0: icmp_seq=2 ttl=64 time=3.05 ms
# Let's add a default route too
root@K-Master:~# ip r add default via 10.0.11.0 dev ens3
root@K-Master:~# ip r
default via 10.0.11.0 dev ens3
10.0.11.0/31 dev ens3 proto kernel scope link src 10.0.11.1
But of course, this shit won’t fly. Kubernetes is an unreliable bastard—nodes reboot constantly for no good reason. So we gotta make this config persistent, maybe with netplan:
root@K-Master:~# cat /etc/netplan/01-KubeBase.yaml
network:
  ethernets:
    ens3:
      addresses:
      - 10.0.11.1/31
      dhcp4: false
      routes:
      -  to: default
         via: 10.0.11.0
  version: 2
Now, let’s SCALE this mother out
Leaf2:
interface Ethernet1
   no switchport
   ip address 10.22.99.1/31
!
interface Ethernet2
   no switchport
   ip address 10.2.22.0/31
!
Leaf3:
interface Ethernet1
   no switchport
   ip address 10.33.99.1/31
!
interface Ethernet2
   no switchport
   ip address 10.3.33.0/31
!
Worker1:
root@k-w1:~#cat <<EOF > /etc/netplan/01-KubeBase.yaml
network:
  ethernets:
    ens3:
      addresses:
      - 10.1.11.1/31
      dhcp4: false
      routes:
      -  to: default
         via: 10.1.11.0
  version: 2
EOF
root@k-w1:~# netplan apply
Worker2:
root@k-w2:~#cat <<EOF > /etc/netplan/01-KubeBase.yaml
network:
  ethernets:
    ens3:
      addresses:
      - 10.2.22.1/31
      dhcp4: false
      routes:
      -  to: default
         via: 10.2.22.0
  version: 2
EOF
root@k-w2:~# netplan apply
Worker3:
root@k-w3:~#cat <<EOF > /etc/netplan/01-KubeBase.yaml
network:
  ethernets:
    ens3:
      addresses:
      - 10.3.33.1/31
      dhcp4: false
      routes:
      -  to: default
         via: 10.3.33.0
  version: 2
EOF
root@k-w3:~# netplan apply
After all this, Worker1 can ping the Master:
root@k-w1:~# ping 10.0.11.1
PING 10.0.11.1 (10.0.11.1) 56(84) bytes of data.
64 bytes from 10.0.11.1: icmp_seq=1 ttl=63 time=5.99 ms
64 bytes from 10.0.11.1: icmp_seq=2 ttl=63 time=24.9 ms
But the others can’t yet because there’s no routing through the spine. As promised, let’s set up simple OSPF.
Configuring the Spine:
interface Ethernet1
   no switchport
   ip address 10.11.99.0/31
!
interface Ethernet2
   no switchport
   ip address 10.22.99.0/31
!
interface Ethernet3
   no switchport
   ip address 10.33.99.0/31
And on all switches, we just fire up OSPF:
router ospf 1
   network 0.0.0.0/0 area 0.0.0.0
(Don’t be this casual with OSPF config in production, but it’s fine for the lab)
OSPF converges:
Spine-1#show ip ospf neighbor
Neighbor ID     Instance VRF      Pri State                  Dead Time   Address         Interface
10.11.99.1      1        default  1   FULL/DR                00:00:29    10.11.99.1      Ethernet1
10.22.99.1      1        default  1   FULL/DR                00:00:30    10.22.99.1      Ethernet2
10.33.99.1      1        default  1   FULL/DR                00:00:35    10.33.99.1      Ethernet3

Spine-1#show ip ro ospf

 O        10.0.11.0/31 [110/20] via 10.11.99.1, Ethernet1
 O        10.1.11.0/31 [110/20] via 10.11.99.1, Ethernet1
 O        10.2.22.0/31 [110/20] via 10.22.99.1, Ethernet2
 O        10.3.33.0/31 [110/20] via 10.33.99.1, Ethernet3
Now all workers can see the master and each other. Proof:
root@k-w3:~# ping 10.0.11.1
PING 10.0.11.1 (10.0.11.1) 56(84) bytes of data.
64 bytes from 10.0.11.1: icmp_seq=1 ttl=61 time=13.6 ms
64 bytes from 10.0.11.1: icmp_seq=2 ttl=61 time=15.7 ms

root@k-w3:~# tracepath 10.0.11.1 -n
 1?: [LOCALHOST]                      pmtu 1500
 1:  10.3.33.0                                             3.027ms
 1:  10.3.33.0                                             2.535ms
 2:  10.33.99.0                                            6.473ms
 3:  10.11.99.1                                           10.034ms
 4:  10.0.11.1                                            11.929ms reached
     Resume: pmtu 1500 hops 4 back 4
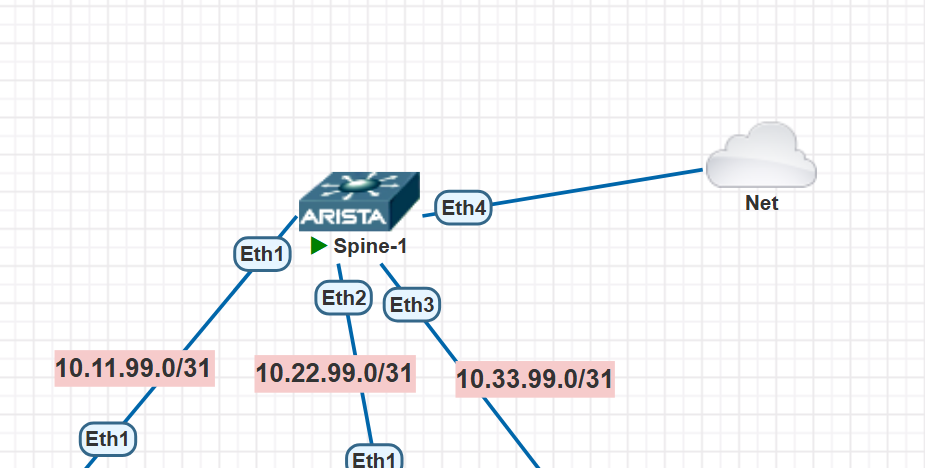
All done! Well, not quite. Our Ubuntu is “bare,” and this Kubernetes thing will probably need to be installed, so we need some kind of Internet access. In PNETLAB, if a host has Internet access, you can create a special cloud of type NAT, connect some interface of some device to it, get an address via DHCP, and enjoy. Since I’m a staunch opponent of connecting anything but leafs to spines, I’m gonna connect the Internet to the spine itself.
Alright, let’s check if the Internet magically appeared on any of our nodes:
user@k-w1:~$ ping 8.8.8.8
PING 8.8.8.8 (8.8.8.8) 56(84) bytes of data.
From 10.1.11.0 icmp_seq=1 Destination Net Unreachable
From 10.1.11.0 icmp_seq=2 Destination Net Unreachable
From 10.1.11.0 icmp_seq=3 Destination Net Unreachable
Well, fuck all works. Probably need to configure something somewhere. On the spine, we get an IP via DHCP on the port and set the default route via the first address in the network (figured that out experimentally):
# Doesn't work:
Spine-1#ping 8.8.8.8
connect: Network is unreachable

# Fixing it
Spine-1#conf t
Spine-1(config)#int ethernet 4
Spine-1(config-if-Et4)#no switchport
Spine-1(config-if-Et4)#ip address dhcp

Spine-1#show ip int ethernet 4 brief
Interface      IP Address           Status      Protocol         MTU    Owner
-------------- -------------------- ----------- ------------- --------- -------
Ethernet4      10.0.137.189/24      up          up              1500

Spine-1(config)#ip route 0.0.0.0 0.0.0.0  10.0.137.1

# It works!
Spine-1#ping 8.8.8.8
PING 8.8.8.8 (8.8.8.8) 72(100) bytes of data.
80 bytes from 8.8.8.8: icmp_seq=1 ttl=99 time=23.2 ms
80 bytes from 8.8.8.8: icmp_seq=2 ttl=99 time=20.6 ms
80 bytes from 8.8.8.8: icmp_seq=3 ttl=99 time=20.6 ms
80 bytes from 8.8.8.8: icmp_seq=4 ttl=99 time=21.2 ms
80 bytes from 8.8.8.8: icmp_seq=5 ttl=99 time=20.7 ms

# Let's propagate the default route through the fabric:
Spine-1(config)#router ospf 1
Spine-1(config-router-ospf)#redistribute static

# The default route made it to the leaf connected to the first worker, and it points to the spine:
Leaf-1#show ip ro 0.0.0.0
Gateway of last resort:
 O E2     0.0.0.0/0 [110/1] via 10.11.99.0, Ethernet1

# Checking on worker1:
user@k-w1:~$ ping 8.8.8.8
PING 8.8.8.8 (8.8.8.8) 56(84) bytes of data.

 :(

# The trace goes where it should:
user@k-w1:~$ tracepath -n 8.8.8.8
 1?: [LOCALHOST]                      pmtu 1500
 1:  10.1.11.0                                             4.290ms
 1:  10.1.11.0                                             2.697ms
 2:  10.11.99.0                                            8.022ms
 3:  no reply
And probably, it goes to the bridge with the node itself, which has NAT configured for the Internet. But the node has no clue about any workers or the networks they live in. So it seems we also need to configure NAT on our exit router (the spine):
Spine-1(config)#ip access-list ACL_NAT
Spine-1(config-acl-ACL_NAT)# permit ip 10.0.0.0/8 any log

Spine-1(config)#int et4
Spine-1(config-if-Et4)#ip nat source dynamic access-list ACL_NAT overload
And it even works, but it works like absolute crap—so damn slowю After all, virtual devices inside PNETLAB aren’t meant for any kind of decent data plane performance.
So, I Am Altering the Deal, Pray I Don’t Alter It Any Further — let’s just add an additional interface to each host, plug them into this Internet cloud, get an address via DHCP, get a default route, and towards the switches, we’ll just set up a static route for the 10.0.0.0/8 network. Something like this, so we end up with:
user@k-w1:~$ ip r

default via 10.0.137.1 dev ens5 proto dhcp src 10.0.137.132 metric 100
10.0.0.0/8 via 10.1.11.0 dev ens3 proto static
10.0.137.0/24 dev ens5 proto kernel scope link src 10.0.137.132 metric 100
10.0.137.1 dev ens5 proto dhcp scope link src 10.0.137.132 metric 100
10.1.11.0/31 dev ens3 proto kernel scope link src 10.1.11.1
ens5 is exactly the new interface plugged into the Internet cloud.
Finally, Kubernetes
Now I’m starting to write about stuff I have no clue about.
CNI
Let me remind you of the main thing about networking technologies: networks by themselves are fucking useless to anyone. Networks are needed for services. Remember that. And the reverse is also true — no modern service works without networks, not even the almighty Kubernetes. In Kube, networking is handled by the CNI—Container Network Interface. Its basic tasks are pretty trivial:
- Assign IP addresses to pods
- Make sure pods can talk to each other
- Make sure pods can talk to the outside world
- Maybe provide a bit of security for the pods
And under the hood of all this, there’s, of course, some magic.
And what the hell are “pods”? Oh man, I really don’t wanna dig deep into all this container orchestration machinery, so I’ll keep it short too — a pod is a group of containers (but usually just one) that share a dedicated network namespace (and therefore an IP address), shared CPU/RAM resources (cgroups), and storage. At the same time, this whole thing is isolated from other similar groups of containers. Basically, it’s the primary building block used to craft modern, trendy microservice applications in Kube. Pods need a network, and the network is the CNI’s responsibility. There are a shitload of different CNIs. The simplest one is probably Flannel, but it seems to use VXLAN under the hood, and I want to build a network on pure, transparent routing. Another popular one to look into could be Cillium — but it seems so goddamn cool and fancy that it’s not suitable for a first try — I’m not about to sit around collecting eBPF hook traces right now. So, I decided to go with a middle ground between Flannel and Cilium — namely, Calico. It supposedly can work without any nasty overlays — you can peer with the switch via BGP right from the node! And the main advantage is that I have absolutely no idea how to configure it, so it should be more fun.
Alright, let’s go. Basic node prep
The zeroth thing to do is to set up hostname resolution to IP addresses, since we don’t have any internal DNS.
So, we just add a few entries to /etc/hosts so our boys can talk to each other by name:
root@K-Master:/home/user# cat /etc/hosts
127.0.0.1 localhost
127.0.1.1 ubuntu
10.0.11.1 k-master
10.1.11.1 k-w1
10.2.22.1 k-w2
The first thing all the manuals suggest doing before installing Kube is to disable swap. Kube really hates swap, period. From what I understand, the problem is that Kube doesn’t know shit about swap — it only cares about the total amount of known memory, and whether that “memory” is divine super-fast DIMM1 or just aHDD — it doesn’t comprehend. So, pods can merrily start writing data to the hard drive instead of RAM, applications will start degrading, and Kube won’t care one bit. We don’t need that, basically.
#  Check for swap:
user@K-Master:~$ sudo free -h
               total        used        free      shared  buff/cache   available
Mem:           3.8Gi       182Mi       2.9Gi       4.0Mi       725Mi       3.4Gi
Swap:          3.8Gi          0B       3.8Gi
# Bam!
user@K-Master:~$ sudo swapoff -a
# And no more swap:
user@K-Master:~$ free -h
               total        used        free      shared  buff/cache   available
Mem:           3.8Gi       188Mi       2.8Gi       4.0Mi       852Mi       3.4Gi
Swap:             0B          0B          0B
# Don't forget to make it persistent:
sudo sed -i '/swap/ s/^\(.*\)$/#\1/g' /etc/fstab
# Figure out your own regex here—the main thing is to comment out the swap line in /etc/fstab, so it looks like this:
user@K-Master:~$ cat /etc/fstab | grep swap
#/swap.img	none	swap	sw	0	0
We pull this little trick on all the hosts.
CRI
Next, we need some kind of engine to run containers on our hosts. That’s the job of the Container Runtime Interface (CRI), and these days the standard is probably containerd
# Install it
user@K-Master:~$ sudo apt update
user@K-Master:~$ sudo apt install -y containerd
# Check
user@K-Master:~$ sudo ctr version
Client:
  Version:  1.7.27
  Revision:
  Go version: go1.22.2

Server:
  Version:  1.7.27
  Revision:
  UUID: ea2054de-47e9-46bd-8243-b0afb0746cdd


# Basic configuration
sudo mkdir -p /etc/containerd
sudo containerd config default | sudo tee /etc/containerd/config.toml
# For some reason, containerd uses cgroupfs by default, but we don't need that. Let systemd handle it.
sudo sed -i 's/SystemdCgroup = false/SystemdCgroup = true/g' /etc/containerd/config.toml
sudo systemctl restart containerd

# Check if containerd is running
sudo systemctl status containerd  # Должен быть "active (running)"
We absolutely gotta say hello to the world!
# Pull the hello-world image
user@k-w1:~$ sudo ctr images pull docker.io/library/hello-world:latest
docker.io/library/hello-world:latest:                                             resolved       |++++++++++++++++++++++++++++++++++++++|
index-sha256:ec153840d1e635ac434fab5e377081f17e0e15afab27beb3f726c3265039cfff:    done           |++++++++++++++++++++++++++++++++++++++|
manifest-sha256:03b62250a3cb1abd125271d393fc08bf0cc713391eda6b57c02d1ef85efcc25c: done           |++++++++++++++++++++++++++++++++++++++|
layer-sha256:e6590344b1a5dc518829d6ea1524fc12f8bcd14ee9a02aa6ad8360cce3a9a9e9:    done           |++++++++++++++++++++++++++++++++++++++|
config-sha256:74cc54e27dc41bb10dc4b2226072d469509f2f22f1a3ce74f4a59661a1d44602:   done           |++++++++++++++++++++++++++++++++++++++|
elapsed: 3.2 s                                                                    total:  13.1 K (4.1 KiB/s)
unpacking linux/amd64 sha256:ec153840d1e635ac434fab5e377081f17e0e15afab27beb3f726c3265039cfff...
done: 50.983582ms
user@k-w1:~$

# Run the hello-world container
user@k-w1:~$ sudo ctr run --rm docker.io/library/hello-world:latest hello-world

Hello from Docker!
BLA BLA BLA
Finally, let’s run a PROPER container, get a shell, and look around:
user@K-Master:~$ sudo ctr images pull docker.io/library/alpine:latest
docker.io/library/alpine:latest:                                                  resolved       |++++++++++++++++++++++++++++++++++++++|
index-sha256:4bcff63911fcb4448bd4fdacec207030997caf25e9bea4045fa6c8c44de311d1:    done           |++++++++++++++++++++++++++++++++++++++|
manifest-sha256:eafc1edb577d2e9b458664a15f23ea1c370214193226069eb22921169fc7e43f: done           |++++++++++++++++++++++++++++++++++++++|
layer-sha256:9824c27679d3b27c5e1cb00a73adb6f4f8d556994111c12db3c5d61a0c843df8:    done           |++++++++++++++++++++++++++++++++++++++|
config-sha256:9234e8fb04c47cfe0f49931e4ac7eb76fa904e33b7f8576aec0501c085f02516:   done           |++++++++++++++++++++++++++++++++++++++|
elapsed: 1.3 s                                                                    total:   0.0 B (0.0 B/s)
unpacking linux/amd64 sha256:4bcff63911fcb4448bd4fdacec207030997caf25e9bea4045fa6c8c44de311d1...
done: 13.453467ms

# Let's run it

user@k-w1:~$ sudo ctr run -t docker.io/library/alpine:latest alpine_test sh

######## Now we're inside the container

/ ~ uname -a
Linux k-w1 5.15.0-69-generic #76-Ubuntu SMP Fri Mar 17 17:19:29 UTC 2023 x86_64 Linux
/ ~ cat /etc/os-release
NAME="Alpine Linux"
ID=alpine
VERSION_ID=3.22.1
PRETTY_NAME="Alpine Linux v3.22"
HOME_URL="https://alpinelinux.org/"
BUG_REPORT_URL="https://gitlab.alpinelinux.org/alpine/aports/-/issues"
/ ~

# What about the network?

/~ ` ip a
1: lo: <LOOPBACK,UP,LOWER_UP> mtu 65536 qdisc noqueue state UNKNOWN qlen 1000
    link/loopback 00:00:00:00:00:00 brd 00:00:00:00:00:00
    inet 127.0.0.1/8 scope host lo
       valid_lft forever preferred_lft forever
    inet6 ::1/128 scope host
       valid_lft forever preferred_lft forever
So, it’s a standard container—but as you can see, there’s no network setup in there. I won’t go into details on how to set that up (I honestly have no fucking idea) — I’ll just hope that Calico will handle all that for me later.
kubeadm, kubelet, kubectl
This part seems pretty straightforward :) On all future masters and worker nodes, we need to run this:
# 1. Add the Kubernetes repository
sudo mkdir -p /etc/apt/keyrings
curl -fsSL https://pkgs.k8s.io/core:/stable:/v1.28/deb/Release.key | sudo gpg --dearmor -o /etc/apt/keyrings/kubernetes-apt-keyring.gpg
echo "deb [signed-by=/etc/apt/keyrings/kubernetes-apt-keyring.gpg] https://pkgs.k8s.io/core:/stable:/v1.28/deb/ /" | sudo tee /etc/apt/sources.list.d/kubernetes.list

# 2. Update packages and install the components
sudo apt update
sudo apt install -y kubeadm kubelet kubectl

# 3.Hold the versions to prevent accidental upgrades
sudo apt-mark hold kubeadm kubelet kubectl
Let’s check that everything is in order and all our tools are present:
user@k-w1:~$ kubeadm version
kubeadm version: &version.Info{Major:"1", Minor:"28", GitVersion:"v1.28.15", GitCommit:"841856557ef0f6a399096c42635d114d6f2cf7f4", GitTreeState:"clean", BuildDate:"2024-10-22T20:33:16Z", GoVersion:"go1.22.8", Compiler:"gc", Platform:"linux/amd64"}
user@k-w1:~$ kubelet --version
Kubernetes v1.28.15
user@k-w1:~$ kubectl version --client
Client Version: v1.28.15
Kustomize Version: v5.0.4-0.20230601165947-6ce0bf390ce3
Building the Cluster
Aggregating manuals from https://kubernetes.io/ and advice from an LLM, I decided to do this:
sudo kubeadm init --pod-network-cidr=10.66.0.0/16 --control-endpoint=10.0.11.1
I decided and I did:
user@K-Master:~$ sudo kubeadm init --pod-network-cidr=10.66.0.0/16 --control-plane-endpoint=10.0.11.1
I0729 04:40:12.098048  170736 version.go:256] remote version is much newer: v1.33.3; falling back to: stable-1.28
[init] Using Kubernetes version: v1.28.15
[preflight] Running pre-flight checks
error execution phase preflight: [preflight] Some fatal errors occurred:
  [ERROR FileContent--proc-sys-net-bridge-bridge-nf-call-iptables]: /proc/sys/net/bridge/bridge-nf-call-iptables does not exist
  [ERROR FileContent--proc-sys-net-ipv4-ip_forward]: /proc/sys/net/ipv4/ip_forward contents are not set to 1
[preflight] If you know what you are doing, you can make a check non-fatal with `--ignore-preflight-errors=...`
To see the stack trace of this error execute with --v=5 or higher
Pre-flight checks failed—we need to enable a couple of kernel options: routing (ip_forward) and netfilter processing for packets traversing bridges. BRIIIDGE?! Who said “bridge”? In my worldview, no bridges should appear (we’re using pure routing + veth pairs to the pods). Well, Kubernetes doesn’t know what I know — it has no idea if I’ll use bridges or not, so let’s not confuse it.
Let’s enable bridge-nf-call-iptables:
# Load the kernel module
user@K-Master:~$ sudo modprobe br_netfilter
# Double-check
user@K-Master:~$ lsmod | grep br_netfilter
br_netfilter           32768  0
bridge                307200  1 br_netfilter
# Make it persistent
user@K-Master:~$ echo "br_netfilter" | sudo tee /etc/modules-load.d/br_netfilter.conf
br_netfilter
And every network engineer knows how to enable IP forwarding. Since not every network engineer is reading this right now, we do it like this:
user@K-Master:~$ sudo sysctl -w net.ipv4.ip_forward=1
net.ipv4.ip_forward = 1
Let’s try again and see what errors await us now!
Well, seems I jinxed it and there are no errors. kubeadm did a ton of work:
I0730 03:53:56.693629  171936 version.go:256] remote version is much newer: v1.33.3; falling back to: stable-1.28
[init] Using Kubernetes version: v1.28.15
[preflight] Running pre-flight checks
[preflight] Pulling images required for setting up a Kubernetes cluster
[preflight] This might take a minute or two, depending on the speed of your internet connection
[preflight] You can also perform this action in beforehand using 'kubeadm config images pull'
W0730 03:54:19.733292  171936 checks.go:835] detected that the sandbox image "registry.k8s.io/pause:3.8" of the container runtime is inconsistent with that used by kubeadm. It is recommended that using "registry.k8s.io/pause:3.9" as the CRI sandbox image.
[certs] Using certificateDir folder "/etc/kubernetes/pki"
[certs] Generating "ca" certificate and key
[certs] Generating "apiserver" certificate and key
[certs] apiserver serving cert is signed for DNS names [k-master kubernetes kubernetes.default kubernetes.default.svc kubernetes.default.svc.cluster.local] and IPs [10.96.0.1 10.0.137.12 10.0.11.1]
[certs] Generating "apiserver-kubelet-client" certificate and key
[certs] Generating "front-proxy-ca" certificate and key
[certs] Generating "front-proxy-client" certificate and key
[certs] Generating "etcd/ca" certificate and key
[certs] Generating "etcd/server" certificate and key
[certs] etcd/server serving cert is signed for DNS names [k-master localhost] and IPs [10.0.137.12 127.0.0.1 ::1]
[certs] Generating "etcd/peer" certificate and key
[certs] etcd/peer serving cert is signed for DNS names [k-master localhost] and IPs [10.0.137.12 127.0.0.1 ::1]
[certs] Generating "etcd/healthcheck-client" certificate and key
[certs] Generating "apiserver-etcd-client" certificate and key
[certs] Generating "sa" key and public key
[kubeconfig] Using kubeconfig folder "/etc/kubernetes"
[kubeconfig] Writing "admin.conf" kubeconfig file
[kubeconfig] Writing "kubelet.conf" kubeconfig file
[kubeconfig] Writing "controller-manager.conf" kubeconfig file
[kubeconfig] Writing "scheduler.conf" kubeconfig file
[etcd] Creating static Pod manifest for local etcd in "/etc/kubernetes/manifests"
[control-plane] Using manifest folder "/etc/kubernetes/manifests"
[control-plane] Creating static Pod manifest for "kube-apiserver"
[control-plane] Creating static Pod manifest for "kube-controller-manager"
[control-plane] Creating static Pod manifest for "kube-scheduler"
[kubelet-start] Writing kubelet environment file with flags to file "/var/lib/kubelet/kubeadm-flags.env"
[kubelet-start] Writing kubelet configuration to file "/var/lib/kubelet/config.yaml"
[kubelet-start] Starting the kubelet
[wait-control-plane] Waiting for the kubelet to boot up the control plane as static Pods from directory "/etc/kubernetes/manifests". This can take up to 4m0s
[apiclient] All control plane components are healthy after 11.505483 seconds
[upload-config] Storing the configuration used in ConfigMap "kubeadm-config" in the "kube-system" Namespace
[kubelet] Creating a ConfigMap "kubelet-config" in namespace kube-system with the configuration for the kubelets in the cluster
[upload-certs] Skipping phase. Please see --upload-certs
[mark-control-plane] Marking the node k-master as control-plane by adding the labels: [node-role.kubernetes.io/control-plane node.kubernetes.io/exclude-from-external-load-balancers]
[mark-control-plane] Marking the node k-master as control-plane by adding the taints [node-role.kubernetes.io/control-plane:NoSchedule]
[bootstrap-token] Using token: 4glzzt.3b96mmozrsum72he
[bootstrap-token] Configuring bootstrap tokens, cluster-info ConfigMap, RBAC Roles
[bootstrap-token] Configured RBAC rules to allow Node Bootstrap tokens to get nodes
[bootstrap-token] Configured RBAC rules to allow Node Bootstrap tokens to post CSRs in order for nodes to get long term certificate credentials
[bootstrap-token] Configured RBAC rules to allow the csrapprover controller automatically approve CSRs from a Node Bootstrap Token
[bootstrap-token] Configured RBAC rules to allow certificate rotation for all node client certificates in the cluster
[bootstrap-token] Creating the "cluster-info" ConfigMap in the "kube-public" namespace
[kubelet-finalize] Updating "/etc/kubernetes/kubelet.conf" to point to a rotatable kubelet client certificate and key
[addons] Applied essential addon: CoreDNS
[addons] Applied essential addon: kube-proxy

Your Kubernetes control-plane has initialized successfully!
Successfully! It’s very kind and tells us what to do next—how to be a regular user and how to join other nodes.
To start using your cluster, you need to run the following as a regular user:

  mkdir -p $HOME/.kube
  sudo cp -i /etc/kubernetes/admin.conf $HOME/.kube/config
  sudo chown $(id -u):$(id -g) $HOME/.kube/config

Alternatively, if you are the root user, you can run:

  export KUBECONFIG=/etc/kubernetes/admin.conf

You should now deploy a pod network to the cluster.
Run "kubectl apply -f [podnetwork].yaml" with one of the options listed at:
  https://kubernetes.io/docs/concepts/cluster-administration/addons/

You can now join any number of control-plane nodes by copying certificate authorities
and service account keys on each node and then running the following as root:

  kubeadm join 10.0.11.1:6443 --token 4glzzt.3b96mmozrsum72he \
  --discovery-token-ca-cert-hash sha256:557100ad9c340873e4d2d4e329fd303ba274548f1188030ad9c6569a2f745e42 \
  --control-plane

Then you can join any number of worker nodes by running the following on each as root:

kubeadm join 10.0.11.1:6443 --token 4glzzt.3b96mmozrsum72he \
  --discovery-token-ca-cert-hash sha256:557100ad9c340873e4d2d4e329fd303ba274548f1188030ad9c6569a2f745e42
My fingers are itching to run kubectl get pods :)
user@K-Master:~$ kubectl get pods
E0730 04:20:56.695021  173012 memcache.go:265] couldn't get current server API group list: Get "http://localhost:8080/api?timeout=32s": dial tcp 127.0.0.1:8080: connect: connection refused
E0730 04:20:56.695309  173012 memcache.go:265] couldn't get current server API group list: Get "http://localhost:8080/api?timeout=32s": dial tcp 127.0.0.1:8080: connect: connection refused
E0730 04:20:56.696762  173012 memcache.go:265] couldn't get current server API group list: Get "http://localhost:8080/api?timeout=32s": dial tcp 127.0.0.1:8080: connect: connection refused
E0730 04:20:56.697186  173012 memcache.go:265] couldn't get current server API group list: Get "http://localhost:8080/api?timeout=32s": dial tcp 127.0.0.1:8080: connect: connection refused
E0730 04:20:56.698598  173012 memcache.go:265] couldn't get current server API group list: Get "http://localhost:8080/api?timeout=32s": dial tcp 127.0.0.1:8080: connect: connection refused
The connection to the server localhost:8080 was refused - did you specify the right host or port?
It’s clearly trying to connect to the wrong place :( That’s because I’m not reading what the console is telling me, even though it clearly said:
To start using your cluster, you need to run the following as a regular user:

  mkdir -p $HOME/.kube
  sudo cp -i /etc/kubernetes/admin.conf $HOME/.kube/config
  sudo chown $(id -u):$(id -g) $HOME/.kube/config
Better already:
user@K-Master:~$ kubectl get pods
No resources found in default namespace.
Well, at least it responded. What basically happened? I just copied the file that resulted from the initialization (/etc/kubernetes/admin.conf) to the $HOME/.kube/ directory. The kubectl utility is used to talk to the Kubernetes cluster via an API. It needs to get the address and some credentials for that API from somewhere. By default, kubectl looks for it in the file ~/.kube/config.
It looks like this (I’ll trim the keys to not waste pixels on the screen):
apiVersion: v1
clusters:
- cluster:
    certificate-authority-data:
    LS0tLS1CRUdJTBLA-BLA-BLA
    server: https://10.0.11.1:6443
  name: kubernetes
contexts:
- context:
    cluster: kubernetes
    user: kubernetes-admin
  name: kubernetes-admin@kubernetes
current-context: kubernetes-admin@kubernetes
kind: Config
preferences: {}
users:
- name: kubernetes-admin
  user:
    client-certificate-data:
    BLA BLA
    client-key-data:
    LS0tLBLA BL BLA
Alternatively, you can get the file’s contents using the command kubectl config view — it will show roughly the same thing.
It’s important to say—this file is used by the kubectl utility, and kubectl is just a “client” you use to connect to an API and talk to a remote cluster. I’m just running it on the master where I deployed the cluster to avoid switching consoles, but otherwise—you can copy this file anywhere you have the kubectl utility and run it from there—the main thing is to have network access to the master.
Anyway, let’s go from any worker to the master and snatch the file for ourselves!
# At first, nothing works:
user@k-w1:~$ kubectl get pods
E0801 05:56:06.934129  186485 memcache.go:265] couldn't get current server API group list: Get "http://localhost:8080/api?timeout=32s": dial tcp 127.0.0.1:8080: connect: connection refused
E0801 05:56:06.935916  186485 memcache.go:265] couldn't get current server API group list: Get "http://localhost:8080/api?timeout=32s": dial tcp 127.0.0.1:8080: connect: connection refused
E0801 05:56:06.936529  186485 memcache.go:265] couldn't get current server API group list: Get "http://localhost:8080/api?timeout=32s": dial tcp 127.0.0.1:8080: connect: connection refused
E0801 05:56:06.938000  186485 memcache.go:265] couldn't get current server API group list: Get "http://localhost:8080/api?timeout=32s": dial tcp 127.0.0.1:8080: connect: connection refused
E0801 05:56:06.938450  186485 memcache.go:265] couldn't get current server API group list: Get "http://localhost:8080/api?timeout=32s": dial tcp 127.0.0.1:8080: connect: connection refused
The connection to the server localhost:8080 was refused - did you specify the right host or port? '

# Let's grab the file!

user@k-w1:~$ sftp user@K-Master
user@k-master's password:
Connected to K-Master.
sftp> cd .kube/
sftp> ls -la
drwxrwxr-x    3 user     user         4096 Jul 30 04:23 .
drwxr-x---    6 user     user         4096 Aug  1 05:25 ..
drwxr-x---    4 user     user         4096 Jul 30 04:23 cache
-rw-------    1 user     user         5641 Jul 30 04:22 config
sftp> get config
Fetching /home/user/.kube/config to config
config                                                                                                   100% 5641    18.2KB/s   00:00
sftp>
sftp>
sftp> exit
user@k-w1:~$ mkdir .kube
user@k-w1:~$ mv config .kube/config

# Let's check again:

user@k-w1:~$ kubectl get pods
No resources found in default namespace.
So, we ran kubectl, it looked at our local kubeconfig file, took the line https://10.0.11.1:6443 from the local file, and went there to communicate.
It’s also worth mentioning — the config file can, of course, contain more than one cluster, and you can switch between them.
Here’s an example from my home computer; my kubectl config file has 65 lines containing the word “server”:
kubectl config view | Select-String "server" | Measure-Object -Line

Lines Words Characters Property
----- ----- ---------- --------
   65
You can get a list of contexts, i.e., clusters “available” to you based on your config, with the command kubectl config get-contexts. You can find out where you are currently with kubectl config current-context, switch between contexts with kubectl config use-context <YOUR_DESIRED_CONTEXT>, and some smart folks even wrote kubectx to do it faster — https://github.com/ahmetb/kubectx.
Anyway, screw the contexts! We have a more serious problem here — no pods!
user@k-w1:~$ kubectl get pods
No resources found in default namespace.
You might think it’s because we haven’t created anything yet, but surely such a complex mechanism as Kubernetes didn’t create anything for itself?
Let’s try this:
user@k-w1:~$ kubectl get pods -A
NAMESPACE     NAME                               READY   STATUS    RESTARTS   AGE
kube-system   coredns-5dd5756b68-hjxxk           0/1     Pending   0          2d2h
kube-system   coredns-5dd5756b68-mx2x2           0/1     Pending   0          2d2h
kube-system   etcd-k-master                      1/1     Running   0          2d2h
kube-system   kube-apiserver-k-master            1/1     Running   0          2d2h
kube-system   kube-controller-manager-k-master   1/1     Running   0          2d2h
kube-system   kube-proxy-dsf2f                   1/1     Running   0          2d2h
kube-system   kube-scheduler-k-master            1/1     Running   0          2d2h
Aha, there’s something.
The -A flag kinda hints to our kubectl—show me not just in the current namespace, but in all of them, what you’ve got.
And now we get a NAMESPACE column in the output for clarity.
You can read about namespaces in Kube here. For now, it’s important to understand two things:
Namespaces are tools for isolating cluster resources (kind of like tenants) — you made a cluster, made a namespace for Bob to play in, and made one for Alice because Alice doesn’t play, he’s busy with work.
This is not the same thing as Linux namespaces — this abstraction in Kube is much higher-level than in Linux.
You can see what namespaces exist like this:
user@k-w1:~$ kubectl get ns
NAME              STATUS   AGE
default           Active   2d5h
kube-node-lease   Active   2d5h
kube-public       Active   2d5h
kube-system       Active   2d5h
Joining Nodes to the Cluster
Alright, I really need to add the workers to our cluster because right now I only see the master:
user@k-w1:~$  kubectl get nodes
NAME       STATUS     ROLES           AGE    VERSION
k-master   NotReady   control-plane   2d5h   v1.28.15
If we go back a bit to the cluster initialization result, I’ll remind you that the master told us exactly what to do to join a node to it. Let’s try:
user@k-w1:~$ sudo kubeadm join 10.0.11.1:6443 \
  --token 4glzzt.3b96mmozrsum72he \
  --discovery-token-ca-cert-hash sha256:557100ad9c340873e4d2d4e329fd303ba274548f1188030ad9c6569a2f745e42
[sudo] password for user:
[preflight] Running pre-flight checks
error execution phase preflight: [preflight] Some fatal errors occurred:
  [ERROR FileContent--proc-sys-net-bridge-bridge-nf-call-iptables]: /proc/sys/net/bridge/bridge-nf-call-iptables does not exist
  [ERROR FileContent--proc-sys-net-ipv4-ip_forward]: /proc/sys/net/ipv4/ip_forward contents are not set to 1
[preflight] If you know what you are doing, you can make a check non-fatal with `--ignore-preflight-errors=...`
To see the stack trace of this error execute with --v=5 or higher
Here we go again! Let’s fix it:
user@k-w1:~$ sudo modprobe br_netfilter
user@k-w1:~$ echo "br_netfilter" | sudo tee /etc/modules-load.d/br_netfilter.conf
br_netfilter
user@k-w1:~$ sudo sysctl -w net.ipv4.ip_forward=1
net.ipv4.ip_forward = 1
Let’s try again. I entered the Join command, sitting, waiting… a minute, two, it’s suspicious. I decided to check if it’s making progress. Where to look—I have no idea, so like a typical network engineer, I decided to see if there’s any interaction happening:
user@k-w1:~$ sudo tcpdump -i any -n host 10.0.11.1
tcpdump: data link type LINUX_SLL2
tcpdump: verbose output suppressed, use -v[v]... for full protocol decode
listening on any, link-type LINUX_SLL2 (Linux cooked v2), snapshot length 262144 bytes
09:34:46.678488 ens3  Out IP 10.1.11.1.47196 > 10.0.11.1.6443: Flags [P.], seq 3173377766:3173377804, ack 458422059, win 501, options [nop,nop,TS val 785132122 ecr 906488627], length 38
09:34:46.687859 ens3  In  IP 10.0.11.1.6443 > 10.1.11.1.47196: Flags [P.], seq 1:91, ack 38, win 507, options [nop,nop,TS val 906494937 ecr 785132122], length 90
09:34:46.687875 ens3  Out IP 10.1.11.1.47196 > 10.0.11.1.6443: Flags [.], ack 91, win 501, options [nop,nop,TS val 785132131 ecr 906494937], length 0
09:34:46.739604 ens3  In  IP 10.0.11.1.6443 > 10.1.11.1.47196: Flags [P.], seq 1539:2226, ack 38, win 507, options [nop,nop,TS val 906494988 ecr 785132131], length 687
09:34:46.739633 ens3  Out IP 10.1.11.1.47196 > 10.0.11.1.6443: Flags [.], ack 91, win 501, options [nop,nop,TS val 785132183 ecr 906494937,nop,nop,sack 1 {1539:2226}], length 0
09:34:46.745540 ens3  In  IP 10.0.11.1.6443 > 10.1.11.1.47196: Flags [.], seq 91:1539, ack 38, win 507, options [nop,nop,TS val 906494995 ecr 785132183], length 1448
09:34:46.745551 ens3  Out IP 10.1.11.1.47196 > 10.0.11.1.6443: Flags [.], ack 2226, win 497, options [nop,nop,TS val 785132189 ecr 906494995], length 0
09:34:46.745705 ens3  Out IP 10.1.11.1.47196 > 10.0.11.1.6443: Flags [P.], seq 38:73, ack 2226, win 501, options [nop,nop,TS val 785132189 ecr 906494995], length 35
09:34:46.796413 ens3  In  IP 10.0.11.1.6443 > 10.1.11.1.47196: Flags [.], ack 73, win 507, options [nop,nop,TS val 906495044 ecr 785132189], length 0
So, they’re doing something, I won’t interfere. I’ll wait.
I waited:
[preflight] Running pre-flight checks
error execution phase preflight: couldn't validate the identity of the API Server: could not find a JWS signature in the cluster-info ConfigMap for token ID "4glzzt"
To see the stack trace of this error execute with --v=5 or higher
At first, I thought it was angry about the dot in the token—because the error uses “4glzzt”, but the command was --token 4glzzt.3b96mmozrsum72he. But that’s, of course, complete nonsense, so I had to google and talk to an AI about it. As it turned out — my token had expired—by default, it lives for 24 hours, and I did the initialization a couple of days ago and then went to work.
It’s not in the list of live tokens:
user@K-Master:~$ sudo kubeadm token list
user@K-Master:~$
Let’s make a new token:
user@K-Master:~$ sudo kubeadm token create
ya36sc.cregu6et22m9j7q5
user@K-Master:~$ sudo kubeadm token list
TOKEN                     TTL         EXPIRES                USAGES                   DESCRIPTION                                                EXTRA GROUPS
ya36sc.cregu6et22m9j7q5   23h         2025-08-02T09:47:10Z   authentication,signing   <none>                                                     system:bootstrappers:kubeadm:default-node-token
The second parameter in kubeadm join is the hash of the master’s certificate, which hasn’t changed for us. Let’s try this:
user@k-w1:~$ sudo kubeadm join 10.0.11.1:6443 \
  --token ya36sc.cregu6et22m9j7q5 \
  --discovery-token-ca-cert-hash sha256:557100ad9c340873e4d2d4e329fd303ba274548f1188030ad9c6569a2f745e42
It immediately started working:
[preflight] Running pre-flight checks
[preflight] Reading configuration from the cluster...
[preflight] FYI: You can look at this config file with 'kubectl -n kube-system get cm kubeadm-config -o yaml'
[kubelet-start] Writing kubelet configuration to file "/var/lib/kubelet/config.yaml"
[kubelet-start] Writing kubelet environment file with flags to file "/var/lib/kubelet/kubeadm-flags.env"
[kubelet-start] Starting the kubelet
[kubelet-start] Waiting for the kubelet to perform the TLS Bootstrap...

This node has joined the cluster:
* Certificate signing request was sent to apiserver and a response was received.
* The Kubelet was informed of the new secure connection details.

Run 'kubectl get nodes' on the control-plane to see this node join the cluster.
Now we can see our worker!
user@k-w1:~$ kubectl get nodes
NAME       STATUS     ROLES           AGE    VERSION
k-master   NotReady   control-plane   2d5h   v1.28.15
k-w1       NotReady   <none>          49s    v1.28.15
After that, we do the same thing on worker-2 and worker-3.
user@k-w1:~$ kubectl get nodes
NAME       STATUS     ROLES           AGE     VERSION
k-master   NotReady   control-plane   2d5h    v1.28.15
k-w1       NotReady   <none>          3m31s   v1.28.15
k-w2       NotReady   <none>          14s     v1.28.15
k-w3       NotReady   <none>          5s      v1.28.15
So— as planned— one master and three workers. However, they are all in a NotReady state and, accordingly, are not ready to carry any useful load. Well, as a certain famous Innokenty said — “Let’s figure it out!”
The best friend when trying to get the maximum amount of information about any Kubernetes object is kubectl describe - you can read about it here.
Let’s try to get information about any of our nodes:
user@K-Master:~$ kubectl describe node k-master
Name:               k-master
Roles:              control-plane
Labels:             beta.kubernetes.io/arch=amd64
                    beta.kubernetes.io/os=linux
                    kubernetes.io/arch=amd64
                    kubernetes.io/hostname=k-master
                    kubernetes.io/os=linux
                    node-role.kubernetes.io/control-plane=
                    node.kubernetes.io/exclude-from-external-load-balancers=
Annotations:        kubeadm.alpha.kubernetes.io/cri-socket: unix:///var/run/containerd/containerd.sock
                    node.alpha.kubernetes.io/ttl: 0
                    volumes.kubernetes.io/controller-managed-attach-detach: true
CreationTimestamp:  Wed, 30 Jul 2025 03:54:44 +0000
Taints:             node-role.kubernetes.io/control-plane:NoSchedule
                    node.kubernetes.io/not-ready:NoSchedule
Unschedulable:      false
Lease:
  HolderIdentity:  k-master
  AcquireTime:     <unset>
  RenewTime:       Fri, 01 Aug 2025 10:20:47 +0000
Conditions:
  Type             Status  LastHeartbeatTime                 LastTransitionTime                Reason                       Message
  ----             ------  -----------------                 ------------------                ------                       -------
  MemoryPressure   False   Fri, 01 Aug 2025 10:20:49 +0000   Wed, 30 Jul 2025 03:54:42 +0000   KubeletHasSufficientMemory   kubelet has sufficient memory available
  DiskPressure     False   Fri, 01 Aug 2025 10:20:49 +0000   Wed, 30 Jul 2025 03:54:42 +0000   KubeletHasNoDiskPressure     kubelet has no disk pressure
  PIDPressure      False   Fri, 01 Aug 2025 10:20:49 +0000   Wed, 30 Jul 2025 03:54:42 +0000   KubeletHasSufficientPID      kubelet has sufficient PID available
  Ready            False   Fri, 01 Aug 2025 10:20:49 +0000   Wed, 30 Jul 2025 03:54:42 +0000   KubeletNotReady              container runtime network not ready: NetworkReady=false reason:NetworkPluginNotReady message:Network plugin returns error: cni plugin not initialized
Addresses:
  InternalIP:  10.0.11.1
  Hostname:    k-master
Capacity:
  cpu:                2
  ephemeral-storage:  59543468Ki
  hugepages-2Mi:      0
  memory:             4018140Ki
  pods:               110
Allocatable:
  cpu:                2
  ephemeral-storage:  54875260018
  hugepages-2Mi:      0
  memory:             3915740Ki
  pods:               110
System Info:
  Machine ID:                 9b501691e27e441fa1ddadcbde6948b8
  System UUID:                adb6f6f8-3ebd-4da3-bb18-15d69dfd3393
  Boot ID:                    3c2d4346-5c1b-425e-8463-164b41d90f0c
  Kernel Version:             5.15.0-69-generic
  OS Image:                   Ubuntu 22.04.2 LTS
  Operating System:           linux
  Architecture:               amd64
  Container Runtime Version:  containerd://1.7.27
  Kubelet Version:            v1.28.15
  Kube-Proxy Version:         v1.28.15
PodCIDR:                      10.66.0.0/24
PodCIDRs:                     10.66.0.0/24
Non-terminated Pods:          (5 in total)
  Namespace                   Name                                CPU Requests  CPU Limits  Memory Requests  Memory Limits  Age
  ---------                   ----                                ------------  ----------  ---------------  -------------  ---
  kube-system                 etcd-k-master                       100m (5%)     0 (0%)      100Mi (2%)       0 (0%)         2d6h
  kube-system                 kube-apiserver-k-master             250m (12%)    0 (0%)      0 (0%)           0 (0%)         2d6h
  kube-system                 kube-controller-manager-k-master    200m (10%)    0 (0%)      0 (0%)           0 (0%)         2d6h
  kube-system                 kube-proxy-dsf2f                    0 (0%)        0 (0%)      0 (0%)           0 (0%)         2d6h
  kube-system                 kube-scheduler-k-master             100m (5%)     0 (0%)      0 (0%)           0 (0%)         2d6h
Allocated resources:
  (Total limits may be over 100 percent, i.e., overcommitted.)
  Resource           Requests    Limits
  --------           --------    ------
  cpu                650m (32%)  0 (0%)
  memory             100Mi (2%)  0 (0%)
  ephemeral-storage  0 (0%)      0 (0%)
  hugepages-2Mi      0 (0%)      0 (0%)
Events:              <none>
The interesting part for us is the Conditions section, where there is a condition type called “Ready”. And there you can clearly see why the node isn’t Ready: - “container runtime network not ready: NetworkReady=false reason:NetworkPluginNotReady message:Network plugin returns error: cni plugin not initialized”
Alternatively, you can extract this information as pretty JSON like this (of course, you need to understand the structure — know where to poke):
user@K-Master:~$ kubectl get node k-master -o jsonpath='{.status.conditions}' | jq '.[] | select(.type == "Ready")'
{
  "lastHeartbeatTime": "2025-08-01T10:31:02Z",
  "lastTransitionTime": "2025-07-30T03:54:42Z",
  "message": "container runtime network not ready: NetworkReady=false reason:NetworkPluginNotReady message:Network plugin returns error: cni plugin not initialized",
  "reason": "KubeletNotReady",
  "status": "False",
  "type": "Ready"
}
So, as you can see—it’s the network engineers’ fault again! - NetworkReady=false - the network isn’t ready, dammit!
And it’s not ready because Network plugin returns error: cni plugin not initialized !
We forgot about the CNI, basically.
Calico
I remind you that I decided to go with Calico, and I’m sticking with it!
Let’s install Calico with one line:
user@K-Master:~$ kubectl apply -f https://docs.projectcalico.org/manifests/calico.yaml
poddisruptionbudget.policy/calico-kube-controllers created
serviceaccount/calico-kube-controllers created
serviceaccount/calico-node created
configmap/calico-config created
customresourcedefinition.apiextensions.k8s.io/bgpconfigurations.crd.projectcalico.org created
customresourcedefinition.apiextensions.k8s.io/bgppeers.crd.projectcalico.org created
customresourcedefinition.apiextensions.k8s.io/blockaffinities.crd.projectcalico.org created
customresourcedefinition.apiextensions.k8s.io/caliconodestatuses.crd.projectcalico.org created
customresourcedefinition.apiextensions.k8s.io/clusterinformations.crd.projectcalico.org created
customresourcedefinition.apiextensions.k8s.io/felixconfigurations.crd.projectcalico.org created
customresourcedefinition.apiextensions.k8s.io/globalnetworkpolicies.crd.projectcalico.org created
customresourcedefinition.apiextensions.k8s.io/globalnetworksets.crd.projectcalico.org created
customresourcedefinition.apiextensions.k8s.io/hostendpoints.crd.projectcalico.org created
customresourcedefinition.apiextensions.k8s.io/ipamblocks.crd.projectcalico.org created
customresourcedefinition.apiextensions.k8s.io/ipamconfigs.crd.projectcalico.org created
customresourcedefinition.apiextensions.k8s.io/ipamhandles.crd.projectcalico.org created
customresourcedefinition.apiextensions.k8s.io/ippools.crd.projectcalico.org created
customresourcedefinition.apiextensions.k8s.io/ipreservations.crd.projectcalico.org created
customresourcedefinition.apiextensions.k8s.io/kubecontrollersconfigurations.crd.projectcalico.org created
customresourcedefinition.apiextensions.k8s.io/networkpolicies.crd.projectcalico.org created
customresourcedefinition.apiextensions.k8s.io/networksets.crd.projectcalico.org created
clusterrole.rbac.authorization.k8s.io/calico-kube-controllers created
clusterrole.rbac.authorization.k8s.io/calico-node created
clusterrolebinding.rbac.authorization.k8s.io/calico-kube-controllers created
clusterrolebinding.rbac.authorization.k8s.io/calico-node created
daemonset.apps/calico-node created
deployment.apps/calico-kube-controllers created
We downloaded the manifest (https://docs.projectcalico.org/manifests/calico.yaml) from the project’s website and installed Calico!
The nodes, by the way, immediately became Ready:
user@k-w1:~$ kubectl get nodes
NAME       STATUS   ROLES           AGE    VERSION
k-master   Ready    control-plane   2d7h   v1.28.15
k-w1       Ready    <none>          82m    v1.28.15
k-w2       Ready    <none>          79m    v1.28.15
k-w3       Ready    <none>          79m    v1.28.15
Some pods related to Calico appeared on all nodes:
user@K-Master:~$ kubectl get pods -n kube-system -o wide | grep -E 'calico|NAME'
NAME                                       READY   STATUS    RESTARTS   AGE    IP             NODE       NOMINATED NODE   READINESS GATES
calico-kube-controllers-658d97c59c-kq2ld   1/1     Running   0          17m    10.66.207.66   k-w1       <none>           <none>
calico-node-b2rgf                          1/1     Running   0          17m    10.2.22.1      k-w2       <none>           <none>
calico-node-lfbfg                          1/1     Running   0          17m    10.3.33.1      k-w3       <none>           <none>
calico-node-ncqcp                          1/1     Running   0          17m    10.0.11.1      k-master   <none>           <none>
calico-node-wpw78                          1/1     Running   0          17m    10.1.11.1      k-w1       <none>           <none>
Here I immediately noticed the pod calico-kube-controllers-658d97c59c-kq2ld - obviously, this is some kind of controller for our SDN that makes the network work — it gives commands to nodes, tells them what to do, etc. Classic stuff.
But its IP address caught my eye — 10.66.207.66. Yes, during cluster initialization we specified that the pod CIDR would be 10.66.0.0/16, but why exactly 10.66.207.66?
Let’s see what this controller has been up to:
***** Let's look at the IP Pools configured by the CNI *****
user@K-Master:~$ kubectl get ippools -o yaml
apiVersion: v1
items:
- apiVersion: crd.projectcalico.org/v1
  kind: IPPool
  metadata:
    annotations:
      projectcalico.org/metadata: '{"uid":"7c7ea10d-5b11-44bc-996f-762f043ddaf7","creationTimestamp":"2025-08-01T10:58:00Z"}'
    creationTimestamp: "2025-08-01T10:58:00Z"
    generation: 1
    name: default-ipv4-ippool
    resourceVersion: "260252"
    uid: d85f0e55-8dde-49c6-9d80-a8ed5c66419f
  spec:
    allowedUses:
    - Workload
    - Tunnel
    blockSize: 26
    cidr: 10.66.0.0/16
    ipipMode: Always
    natOutgoing: true
    nodeSelector: all()
    vxlanMode: Never
kind: List
metadata:
  resourceVersion: ""
The most interesting part for us is in the spec section:
cidr: 10.66.0.0/16- clear, this is what we set during initializationblockSize: 26- this is the default subnet mask that will be allocated. So, a /26 subnet is taken from 10.66.0.0/16 and given to a node, then Calico will assign IP addresses to pods according to this subnetvxlanMode: Never- pleasantly pleased :)ipipMode: Always- interesting… by default, it seems traffic between pods on different nodes will be encapsulated in IPIP — well, that makes sense — Calico doesn’t yet suspect that we’re building a flat, routed network, and it needs to deliver traffic between pods somehow.natOutgoing: true- similar situation—this option is needed for egress traffic from a pod “outside”—for example, to the Internet or somewhere else beyond the cluster. We’ll change this too, we don’t need this NAT.
Okay, so we found out about some global cluster-level setting. But how do we find out which subnet was allocated to which node? Like this, let’s see which CIDRs our Calico assigned to whom:
user@k-w1:~$ kubectl get blockaffinities -o yaml
apiVersion: v1
items:
- apiVersion: crd.projectcalico.org/v1
  kind: BlockAffinity
  metadata:
    annotations:
      projectcalico.org/metadata: '{"creationTimestamp":null}'
    creationTimestamp: "2025-08-01T10:58:00Z"
    generation: 2
    name: k-master-10-66-73-128-26
    resourceVersion: "260260"
    uid: 0a22823f-17ac-4fa7-bc5a-31ca8d68c0d3
  spec:
    cidr: 10.66.73.128/26
    deleted: "false"
    node: k-master
    state: confirmed
- apiVersion: crd.projectcalico.org/v1
  kind: BlockAffinity
  metadata:
    annotations:
      projectcalico.org/metadata: '{"creationTimestamp":null}'
    creationTimestamp: "2025-08-01T10:58:04Z"
    generation: 2
    name: k-w1-10-66-207-64-26
    resourceVersion: "260300"
    uid: 4a6a748b-ff9e-4a16-a17e-417a116937a2
  spec:
    cidr: 10.66.207.64/26
    deleted: "false"
    node: k-w1
    state: confirmed
- apiVersion: crd.projectcalico.org/v1
  kind: BlockAffinity
  metadata:
    annotations:
      projectcalico.org/metadata: '{"creationTimestamp":null}'
    creationTimestamp: "2025-08-01T10:58:07Z"
    generation: 2
    name: k-w2-10-66-53-192-26
    resourceVersion: "260363"
    uid: aeb048ac-7494-4bd7-bc9e-ae8e52a5f3e5
  spec:
    cidr: 10.66.53.192/26
    deleted: "false"
    node: k-w2
    state: confirmed
- apiVersion: crd.projectcalico.org/v1
  kind: BlockAffinity
  metadata:
    annotations:
      projectcalico.org/metadata: '{"creationTimestamp":null}'
    creationTimestamp: "2025-08-01T10:58:07Z"
    generation: 2
    name: k-w3-10-66-122-192-26
    resourceVersion: "260341"
    uid: e1a233b4-afa5-406e-9292-27da0fc4d4ba
  spec:
    cidr: 10.66.122.192/26
    deleted: "false"
    node: k-w3
    state: confirmed
kind: List
metadata:
  resourceVersion: ""
Or better yet, let’s filter for k-w1 (where our controller settled):
user@k-w1:~$ kubectl get blockaffinities -o json | jq '.items[] | select(.spec.node == "k-w1") |.spec'
{
  "cidr": "10.66.207.64/26",
  "deleted": "false",
  "node": "k-w1",
  "state": "confirmed"
}
Well, now it’s clear — the address 10.66.207.66 is well within the CIDR "10.66.207.64/26".
What’s up with the tunnels?
Let me remind you of our diagram (I even added little clouds with the pod CIDRs for clarity):
So, we have a pod with the controller living on the first worker in the network 10.66.207.64/26. Will it have connectivity to a pod on another node? Especially considering that the Underlay doesn’t know about such routes:
***** Routing table output from switch Leaf3: *****

Leaf-3#show ip ro 10.66.207.66
Gateway of last resort is not set

Leaf-3#show ip ro 10.66.122.194
Gateway of last resort is not set

# Вот всё что есть:
Leaf-3#show ip ro
Gateway of last resort is not set

 O        10.0.11.0/31 [110/30] via 10.33.99.0, Ethernet1
 O        10.1.11.0/31 [110/30] via 10.33.99.0, Ethernet1
 O        10.2.22.0/31 [110/30] via 10.33.99.0, Ethernet1
 C        10.3.33.0/31 is directly connected, Ethernet2
 O        10.11.99.0/31 [110/20] via 10.33.99.0, Ethernet1
 O        10.22.99.0/31 [110/20] via 10.33.99.0, Ethernet1
 C        10.33.99.0/31 is directly connected, Ethernet1
Well then, let’s test it. Let’s create a simple Alpine container, get a shell, and ping our controller:
user@k-w2:~$ kubectl run test-pod --image=alpine --restart=Never --rm -it -- sh
If you don't see a command prompt, try pressing enter.
/ #
/ # ip a
1: lo: <LOOPBACK,UP,LOWER_UP> mtu 65536 qdisc noqueue state UNKNOWN qlen 1000
    link/loopback 00:00:00:00:00:00 brd 00:00:00:00:00:00
    inet 127.0.0.1/8 scope host lo
       valid_lft forever preferred_lft forever
    inet6 ::1/128 scope host
       valid_lft forever preferred_lft forever
2: tunl0@NONE: <NOARP> mtu 1480 qdisc noop state DOWN qlen 1000
    link/ipip 0.0.0.0 brd 0.0.0.0
4: eth0@if9: <BROADCAST,MULTICAST,UP,LOWER_UP,M-DOWN> mtu 1480 qdisc noqueue state UP
    link/ether 02:0a:bb:9f:e4:55 brd ff:ff:ff:ff:ff:ff
    inet 10.66.122.194/32 scope global eth0
       valid_lft forever preferred_lft forever
    inet6 fe80::a:bbff:fe9f:e455/64 scope link
       valid_lft forever preferred_lft forever
We figured out the IP - 10.66.122.194, which falls within the k-w3 pool (10.66.122.192/26). Let’s make sure the pod actually started there:
user@k-w1:~$ kubectl get pods -o wide
NAME       READY   STATUS    RESTARTS   AGE   IP              NODE   NOMINATED NODE   READINESS GATES
test-pod   1/1     Running   0          10m   10.66.122.194   k-w3   <none>           <none>
It’s our node, our IP.
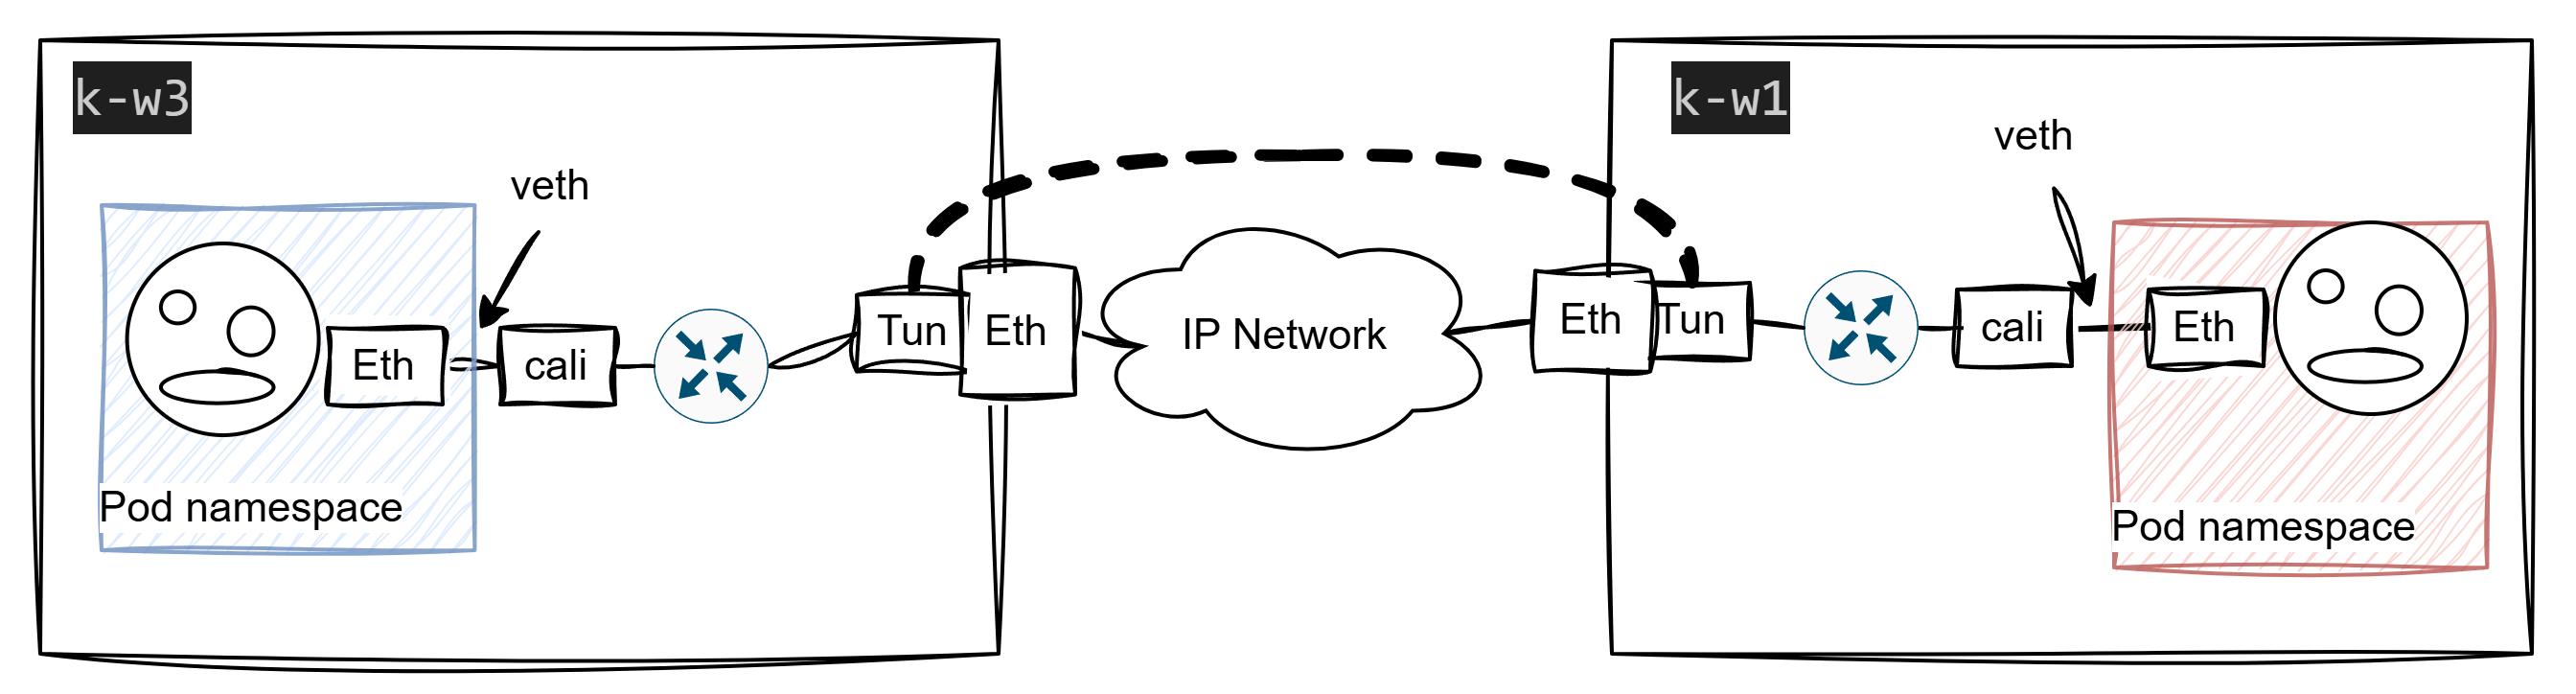
By the way, as you can see from the output above, the container itself has an interface 4: eth0@if9, and judging by the @ symbol, that’s a sure sign of a veth pair.
And where is its buddy? It’s logical to assume that forwarding traffic from the pod anywhere is the responsibility of its mother (the host system), so we should look for the buddy there:
user@k-w3:~$ ip link show
1: lo: <LOOPBACK,UP,LOWER_UP> mtu 65536 qdisc noqueue state UNKNOWN mode DEFAULT group default qlen 1000
    link/loopback 00:00:00:00:00:00 brd 00:00:00:00:00:00
2: ens3: <BROADCAST,MULTICAST,UP,LOWER_UP> mtu 1500 qdisc fq_codel state UP mode DEFAULT group default qlen 1000
    link/ether 50:52:0b:00:6d:00 brd ff:ff:ff:ff:ff:ff
    altname enp0s3
3: ens4: <BROADCAST,MULTICAST,UP,LOWER_UP> mtu 1500 qdisc fq_codel state UP mode DEFAULT group default qlen 1000
    link/ether 50:52:0b:00:6d:01 brd ff:ff:ff:ff:ff:ff
    altname enp0s4
4: ens5: <BROADCAST,MULTICAST,UP,LOWER_UP> mtu 1500 qdisc fq_codel state UP mode DEFAULT group default qlen 1000
    link/ether 50:52:0b:00:6d:02 brd ff:ff:ff:ff:ff:ff
    altname enp0s5
5: tunl0@NONE: <NOARP,UP,LOWER_UP> mtu 1480 qdisc noqueue state UNKNOWN mode DEFAULT group default qlen 1000
    link/ipip 0.0.0.0 brd 0.0.0.0
9: cali7fba7a35b74@if4: <BROADCAST,MULTICAST,UP,LOWER_UP> mtu 1480 qdisc noqueue state UP mode DEFAULT group default
    link/ether ee:ee:ee:ee:ee:ee brd ff:ff:ff:ff:ff:ff link-netns cni-62e568eb-e285-550c-1c3a-5e86eb5dd440
Ah, there it is, look — sitting right there with number 9 - 9: cali7fba7a35b74@if4
Okay, so traffic from the pod exits the pod’s namespace into the root namespace via the veth pair. And then what?
Then it’s classic—the traffic needs to be forwarded somewhere (good thing I enabled net.ipv4.ip_forward=1) according to the local routing table on the host. And what’s there?
If traffic from our pod (10.66.122.194) needs to go to an address of a pod on k-w1 (10.66.207.66), it will go like this:
user@k-w3:~$ ip r get 10.66.207.66
10.66.207.66 via 10.0.137.15 dev tunl0 src 10.66.122.192 uid 1000
    cache
Ah, so there’s the tunnel. What other routes go through it?
user@k-w3:~$ ip r | grep tunl0
10.66.53.192/26 via 10.0.137.112 dev tunl0 proto bird onlink
10.66.73.128/26 via 10.0.137.12 dev tunl0 proto bird onlink
10.66.207.64/26 via 10.0.137.15 dev tunl0 proto bird onlink
So, our k-w3 node knows that traffic to the other three buddies (two workers and the master) needs to be sent into the tunnel.
From the master’s side, for example, it looks like this:
user@K-Master:~$ ip r | grep tunl0
10.66.53.192/26 via 10.0.137.112 dev tunl0 proto bird onlink
10.66.122.192/26 via 10.0.137.142 dev tunl0 proto bird onlink
10.66.207.64/26 via 10.0.137.15 dev tunl0 proto bird onlink
Here are routes to all three workers.
Although, Calico got a bit cheeky here and chose an unexpected path for building the tunnels—it’s using the interfaces I hacked in for Internet access from the nodes, instead of using our beautiful Underlay. Well, God be its judge, it’s not important right now since we’re going to dismantle the tunnels. Anyway, if we sniff traffic on the physical interface of the node through which the tunnel is built, and then run pings from the pod on k-w3 to the pod on k-w1, we’ll see that very IPIP traffic:
user@k-w3:~$ sudo tcpdump -i ens5 -n
tcpdump: verbose output suppressed, use -v[v]... for full protocol decode
listening on ens5, link-type EN10MB (Ethernet), snapshot length 262144 bytes
17:59:59.484554 IP 10.0.137.142 > 10.0.137.15: IP 10.66.122.194 > 10.66.207.66: ICMP echo request, id 18, seq 72, length 64
17:59:59.485009 IP 10.0.137.15 > 10.0.137.142: IP 10.66.207.66 > 10.66.122.194: ICMP echo reply, id 18, seq 72, length 64
18:00:00.484888 IP 10.0.137.142 > 10.0.137.15: IP 10.66.122.194 > 10.66.207.66: ICMP echo request, id 18, seq 73, length 64
18:00:00.485324 IP 10.0.137.15 > 10.0.137.142: IP 10.66.207.66 > 10.66.122.194: ICMP echo reply, id 18, seq 73, length 64
18:00:01.485194 IP 10.0.137.142 > 10.0.137.15: IP 10.66.122.194 > 10.66.207.66: ICMP echo request, id 18, seq 74, length 64
So, this is the scheme we’ve ended up with:
Bird
Another interesting point is how the node learned about these routes. According to the routing table, the kernel was told about it by bird, for God’s sake!
10.66.207.64/26 via 10.0.137.15 dev tunl0 proto bird onlink
So, somewhere deep in this machinery lives a BIRD daemon. Let me try to find this bird’s… shit :) . I won’t go far from k-w3 and will look there. First, I need to understand which pod is responsible for Calico there:
Here it is
user@K-Master:~$ kubectl get pods -A -o wide | grep calico | grep k-w3
kube-system   calico-node-lfbfg       1/1     Running   0          7h48m   10.3.33.1       k-w3   <none>      <none>
Let’s try to get a shell in it and run birdc show protocols:
kubectl exec -it calico-node-lfbfg -n kube-system -- sh
Defaulted container "calico-node" out of: calico-node, upgrade-ipam (init), install-cni (init), mount-bpffs (init)
sh-4.4# birdc
sh: birdc: command not found
I was disappointed at first, but then I googled and found out that birdc has a “lightweight version” — birdcl.
So, this is how it works:
***** You can see the daemon is running
sh-4.4# birdcl show status
BIRD v0.3.3+birdv1.6.8 ready.
BIRD v0.3.3+birdv1.6.8
Router ID is 10.0.137.142
Current server time is 2025-08-03 04:54:44
Last reboot on 2025-08-01 10:58:09
Last reconfiguration on 2025-08-01 10:58:09
Daemon is up and running

***** Interfaces are visible:

sh-4.4# birdcl show interface
BIRD v0.3.3+birdv1.6.8 ready.
lo up (index=1)
  MultiAccess AdminUp LinkUp Loopback Ignored MTU=65536
  127.0.0.1/8 (Primary, scope host)
ens3 up (index=2)
  MultiAccess Broadcast Multicast AdminUp LinkUp MTU=1500
  10.3.33.1/31 (Primary, opposite 10.3.33.0, scope site)
ens4 DOWN (index=3)
  MultiAccess Broadcast Multicast AdminUp LinkUp MTU=1500
ens5 up (index=4)
  MultiAccess Broadcast Multicast AdminUp LinkUp MTU=1500
  10.0.137.142/24 (Primary, scope site)
tunl0 up (index=5)
  MultiAccess AdminUp LinkUp MTU=1480
  10.66.122.192/32 (Primary, scope site)
cali7fba7a35b74 DOWN (index=9)
  MultiAccess Broadcast Multicast AdminUp LinkUp MTU=1480

***** Sessions are established
sh-4.4# birdcl show protocols | grep BGP
Mesh_10_0_137_12 BGP      master   up     2025-08-01  Established
Mesh_10_0_137_15 BGP      master   up     2025-08-01  Established
Mesh_10_0_137_112 BGP      master   up     2025-08-01  Established

*****  Routes have been received:
sh-4.4# birdcl show route
BIRD v0.3.3+birdv1.6.8 ready.
10.66.53.192/26    via 10.0.137.112 on ens5 [Mesh_10_0_137_112 2025-08-01] * (100/0) [i]
10.66.73.128/26    via 10.0.137.12 on ens5 [Mesh_10_0_137_12 2025-08-01] * (100/0) [i]
10.66.207.64/26    via 10.0.137.15 on ens5 [Mesh_10_0_137_15 2025-08-01] * (100/0) [i]
Overall, the logic seems simple—Calico sets up a full mesh iBGP connectivity between all nodes, within which nodes let their buddies know about their pod networks.
If you're curious about the real deep dive stuff under the hood—here's the contents of the Bird configs, which are generated by Calico's internal machinery, using our trusty k-w3 as an example.
function apply_communities ()
{
}

# Generated by confd
include "bird_aggr.cfg";
include "bird_ipam.cfg";

router id 10.0.137.142;

# Configure synchronization between routing tables and kernel.
protocol kernel {
  learn;             # Learn all alien routes from the kernel
  persist;           # Don't remove routes on bird shutdown
  scan time 2;       # Scan kernel routing table every 2 seconds
  import all;
  export filter calico_kernel_programming; # Default is export none
  graceful restart;  # Turn on graceful restart to reduce potential flaps in
                     # routes when reloading BIRD configuration.  With a full
                     # automatic mesh, there is no way to prevent BGP from
                     # flapping since multiple nodes update their BGP
                     # configuration at the same time, GR is not guaranteed to
                     # work correctly in this scenario.
  merge paths on;    # Allow export multipath routes (ECMP)
}

# Watch interface up/down events.
protocol device {
  debug { states };
  scan time 2;    # Scan interfaces every 2 seconds
}

protocol direct {
  debug { states };
  interface -"cali*", -"kube-ipvs*", "*"; # Exclude cali* and kube-ipvs* but
                                          # include everything else.  In
                                          # IPVS-mode, kube-proxy creates a
                                          # kube-ipvs0 interface. We exclude
                                          # kube-ipvs0 because this interface
                                          # gets an address for every in use
                                          # cluster IP. We use static routes
                                          # for when we legitimately want to
                                          # export cluster IPs.
}


# Template for all BGP clients
template bgp bgp_template {
  debug { states };
  description "Connection to BGP peer";
  local as 64512;
  gateway recursive; # This should be the default, but just in case.
  import all;        # Import all routes, since we don't know what the upstream
                     # topology is and therefore have to trust the ToR/RR.
  export filter calico_export_to_bgp_peers;  # Only want to export routes for workloads.
  add paths on;
  graceful restart;  # See comment in kernel section about graceful restart.
  connect delay time 2;
  connect retry time 5;
  error wait time 5,30;
}

# ------------- Node-to-node mesh -------------


# For peer /host/k-master/ip_addr_v4
protocol bgp Mesh_10_0_137_12 from bgp_template {
  multihop;
  ttl security off;
  neighbor 10.0.137.12 as 64512;
  source address 10.0.137.142;  # The local address we use for the TCP connection
}


# For peer /host/k-w1/ip_addr_v4
protocol bgp Mesh_10_0_137_15 from bgp_template {
  multihop;
  ttl security off;
  neighbor 10.0.137.15 as 64512;
  source address 10.0.137.142;  # The local address we use for the TCP connection
  passive on; # Mesh is unidirectional, peer will connect to us.
}


# For peer /host/k-w2/ip_addr_v4
protocol bgp Mesh_10_0_137_112 from bgp_template {
  multihop;
  ttl security off;
  neighbor 10.0.137.112 as 64512;
  source address 10.0.137.142;  # The local address we use for the TCP connection
}


# For peer /host/k-w3/ip_addr_v4
# Skipping ourselves (10.0.137.142)


# ------------- Global peers -------------
# No global peers configured.


# ------------- Node-specific peers -------------
# No node-specific peers configured.
Of course, we could go even deeper down the rabbit hole and talk about HOW EXACTLY these configs appear on the Calico pods, but I don’t want to. In short, there’s this thing called confd that talks to a central storage (well, of course etcd, where else would it go?) and generates configs based on templates.
calicoctl
Damn, it’s high time we started configuring the network and getting rid of these tunnels. But before that, I simply have to mention there’s this other tool called calicoctl. From the name, it should be clear that it manages this whole pile of JSONs and YAMLs at a higher level of abstraction. So, if you haven’t fully embraced the DevOps spirit yet and need a more or less understandable tool to manage your CNI, you should use this one. Here, for example, you can check the current IPAM:
# What is our cluster CIDR
user@K-Master:~$ calicoctl ipam show
+----------+--------------+-----------+------------+--------------+
| GROUPING |     CIDR     | IPS TOTAL | IPS IN USE |   IPS FREE   |
+----------+--------------+-----------+------------+--------------+
| IP Pool  | 10.66.0.0/16 |     65536 | 8 (0%)     | 65528 (100%) |
+----------+--------------+-----------+------------+--------------+

# How the prefixes are distributed
user@k-w1:~$ calicoctl ipam show --show-blocks
+----------+------------------+-----------+------------+--------------+
| GROUPING |       CIDR       | IPS TOTAL | IPS IN USE |   IPS FREE   |
+----------+------------------+-----------+------------+--------------+
| IP Pool  | 10.66.0.0/16     |     65536 | 8 (0%)     | 65528 (100%) |
| Block    | 10.66.122.192/26 |        64 | 2 (3%)     | 62 (97%)     |
| Block    | 10.66.207.64/26  |        64 | 4 (6%)     | 60 (94%)     |
| Block    | 10.66.53.192/26  |        64 | 1 (2%)     | 63 (98%)     |
| Block    | 10.66.73.128/26  |        64 | 1 (2%)     | 63 (98%)     |
+----------+------------------+-----------+------------+--------------+
Or you can look at some pretty detailed information about what’s generally happening:
user@K-Master:~$ calicoctl ipam check --show-all-ips
Checking IPAM for inconsistencies...

Loading all IPAM blocks...
Found 4 IPAM blocks.
 IPAM block 10.66.122.192/26 affinity=host:k-w3:
  10.66.122.192 allocated; attrs Main:ipip-tunnel-addr-k-w3 Extra:node=k-w3,type=ipipTunnelAddress
  10.66.122.194 allocated; attrs Main:k8s-pod-network.a859801be9f0f3d1f827d5e0468b4d49892d9f664cf3bad7840d81e2e1d5275c Extra:namespace=default,node=k-w3,pod=test-pod,timestamp=2025-08-01 15:46:03.586215975 +0000 UTC
 IPAM block 10.66.207.64/26 affinity=host:k-w1:
  10.66.207.64 allocated; attrs Main:ipip-tunnel-addr-k-w1 Extra:node=k-w1,type=ipipTunnelAddress
  10.66.207.65 allocated; attrs Main:k8s-pod-network.fa46412671b665c9f465419e2438c53ff2e8f507e19f1c1e0ec46df242d46943 Extra:namespace=kube-system,node=k-w1,pod=coredns-5dd5756b68-mx2x2,timestamp=2025-08-01 10:58:05.534449903 +0000 UTC
  10.66.207.66 allocated; attrs Main:k8s-pod-network.0385664c41a266d42b7dc0a16a9e9e78e093ac2686324b4bc9e099751cdf2e8f Extra:namespace=kube-system,node=k-w1,pod=calico-kube-controllers-658d97c59c-kq2ld,timestamp=2025-08-01 10:58:05.562415379 +0000 UTC
  10.66.207.67 allocated; attrs Main:k8s-pod-network.9412bb8836cb7d82c57056120496ffcc34cb92acc86ac2668a6429208acbe505 Extra:namespace=kube-system,node=k-w1,pod=coredns-5dd5756b68-hjxxk,timestamp=2025-08-01 10:58:05.637413164 +0000 UTC
 IPAM block 10.66.53.192/26 affinity=host:k-w2:
  10.66.53.192 allocated; attrs Main:ipip-tunnel-addr-k-w2 Extra:node=k-w2,type=ipipTunnelAddress
 IPAM block 10.66.73.128/26 affinity=host:k-master:
  10.66.73.128 allocated; attrs Main:ipip-tunnel-addr-k-master Extra:node=k-master,type=ipipTunnelAddress
IPAM blocks record 8 allocations.

Loading all IPAM pools...
  10.66.0.0/16
Found 1 active IP pools.

Loading all nodes.
  10.66.73.128 belongs to Node(k-master)
  10.66.207.64 belongs to Node(k-w1)
  10.66.53.192 belongs to Node(k-w2)
  10.66.122.192 belongs to Node(k-w3)
Found 4 node tunnel IPs.

Loading all workload endpoints.
  10.66.122.194 belongs to Workload(default/k--w3-k8s-test--pod-eth0)
  10.66.207.66 belongs to Workload(kube-system/k--w1-k8s-calico--kube--controllers--658d97c59c--kq2ld-eth0)
  10.66.207.67 belongs to Workload(kube-system/k--w1-k8s-coredns--5dd5756b68--hjxxk-eth0)
  10.66.207.65 belongs to Workload(kube-system/k--w1-k8s-coredns--5dd5756b68--mx2x2-eth0)
Found 4 workload IPs.
Workloads and nodes are using 8 IPs.

Loading all handles
Looking for top (up to 20) nodes by allocations...
  k-w1 has 4 allocations
  k-w3 has 2 allocations
  k-w2 has 1 allocations
  k-master has 1 allocations
Node with most allocations has 4; median is 1

Scanning for IPs that are allocated but not actually in use...
Found 0 IPs that are allocated in IPAM but not actually in use.
Scanning for IPs that are in use by a workload or node but not allocated in IPAM...
Found 0 in-use IPs that are not in active IP pools.
Found 0 in-use IPs that are in active IP pools but have no corresponding IPAM allocation.

Scanning for IPAM handles with no matching IPs...
Found 0 handles with no matching IPs (and 8 handles with matches).
Scanning for IPs with missing handle...
Found 0 handles mentioned in blocks with no matching handle resource.
Check complete; found 0 problems.
From the output, you can see which IPs got allocated where and what they’re up to. Or you can just check the BGP status:
user@k-w1:~$ sudo calicoctl node status
Calico process is running.

IPv4 BGP status
+--------------+-------------------+-------+------------+-------------+
| PEER ADDRESS |     PEER TYPE     | STATE |   SINCE    |    INFO     |
+--------------+-------------------+-------+------------+-------------+
| 10.0.137.12  | node-to-node mesh | up    | 2025-08-01 | Established |
| 10.0.137.112 | node-to-node mesh | up    | 2025-08-01 | Established |
| 10.0.137.142 | node-to-node mesh | up    | 2025-08-01 | Established |
+--------------+-------------------+-------+------------+-------------+

IPv6 BGP status
You can use calicoctl not only to get status information but also to change the configuration. Let me say it again—calicoctl is just an abstraction layer on top of this whole mess of configuration files.
BGP to the Underlay!
Alright, no matter how hard I tried to delay this moment by diving into the details of how everything works here, it’s time to head towards the finish line. Anyway — the deeper you dig, the more you realize you understand fuck all. And I’m not a perfectionist — I don’t sabotage my work.
So, let’s finally get to some network engineer practice.
Change the pools from the default /26 to at least /24
Disable the damn tunnels and NAT, because…
Configure BGP towards the ToRs and create a flat, routable network
What’s the point of this anyway? Well, the point is simple—I want to see my pods transparently across the network from the “external” world, for example, from this specially created user machine:
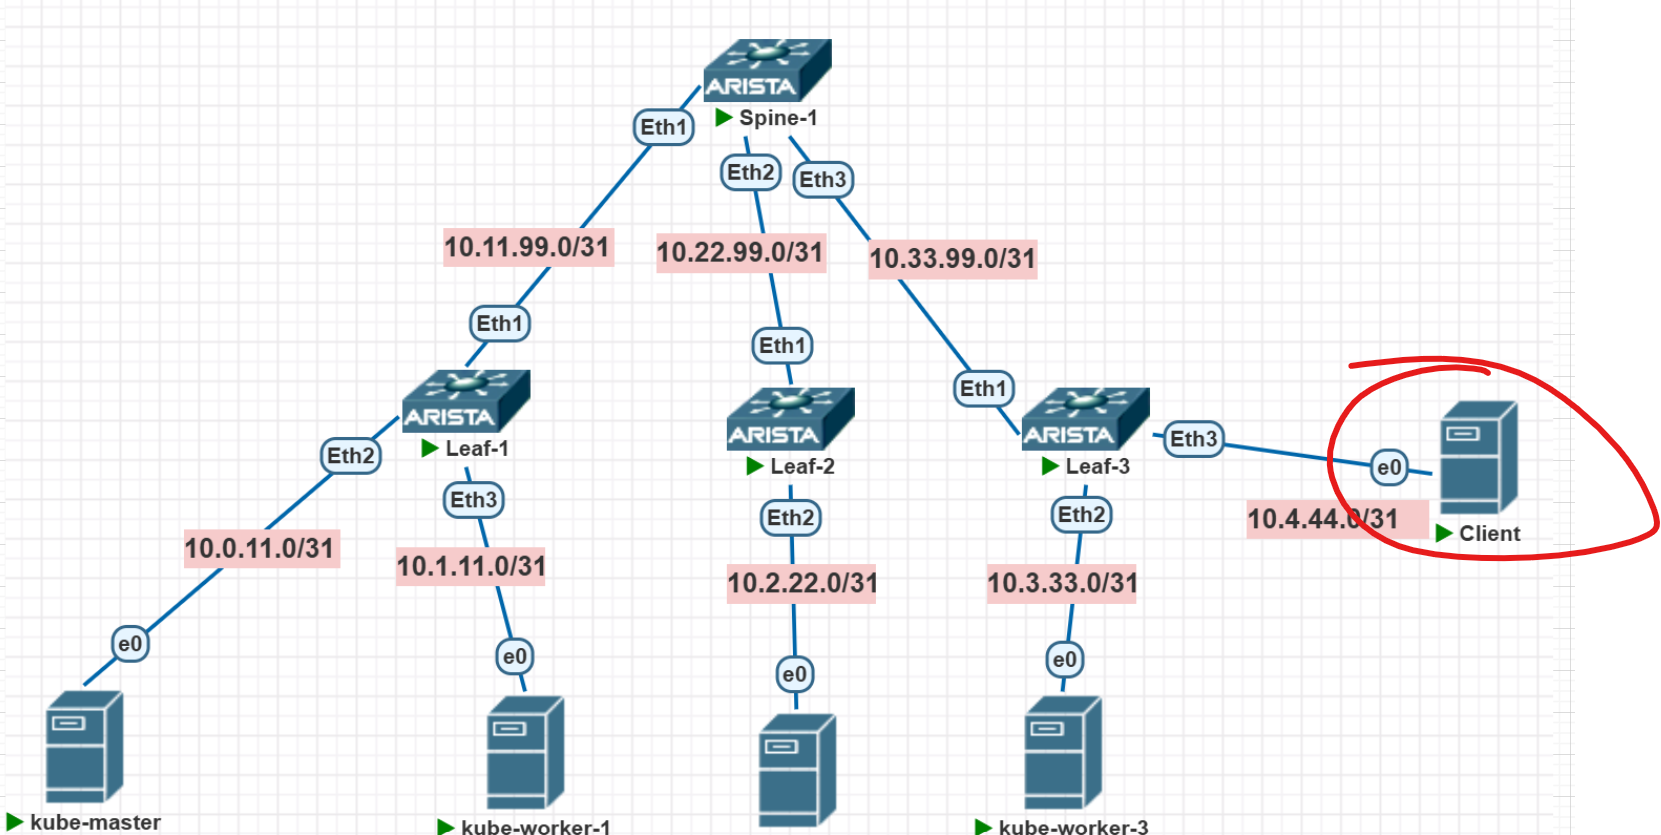
Right now, from there I can see my gateway:
user@Kuber-Puper-User:~$ ping 10.4.44.0
PING 10.4.44.0 (10.4.44.0) 56(84) bytes of data.
64 bytes from 10.4.44.0: icmp_seq=1 ttl=64 time=4.05 ms
64 bytes from 10.4.44.0: icmp_seq=2 ttl=64 time=3.11 ms
and even the nodes:
user@Kuber-Puper-User:~$ ping 10.1.11.1
PING 10.1.11.1 (10.1.11.1) 56(84) bytes of data.
64 bytes from 10.1.11.1: icmp_seq=1 ttl=61 time=22.9 ms
64 bytes from 10.1.11.1: icmp_seq=2 ttl=61 time=19.0 ms
^C
--- 10.1.11.1 ping statistics ---
2 packets transmitted, 2 received, 0% packet loss, time 1000ms
rtt min/avg/max/mdev = 18.951/20.915/22.880/1.964 ms

user@Kuber-Puper-User:~$ ssh user@10.1.11.1
The authenticity of host '10.1.11.1 (10.1.11.1)' can't be established.
ED25519 key fingerprint is SHA256:hiK+HiiCH4w8qfsES+m5m33FCm4+/a+aE9Nko69S7Us.
This key is not known by any other names
Are you sure you want to continue connecting (yes/no/[fingerprint])? yes
Warning: Permanently added '10.1.11.1' (ED25519) to the list of known hosts.
user@10.1.11.1's password:

user@k-w1:~$
But not the pods. Damn, I forgot what the pod IP addresses were:
user@k-w1:~$ kubectl get pods -A \
  -o custom-columns="NAMESPACE:.metadata.namespace,NAME:.metadata.name,IP:.status.podIP" \
  --no-headers \
  | grep -E "test-pod|calico-kube"
default       test-pod                                   10.66.122.194
kube-system   calico-kube-controllers-658d97c59c-kq2ld   10.66.207.66
Ah, right. So, nothing pings from the user node :(
user@Kuber-Puper-User:~$ ping 10.66.122.194
PING 10.66.122.194 (10.66.122.194) 56(84) bytes of data.
From 10.4.44.0 icmp_seq=1 Destination Net Unreachable
From 10.4.44.0 icmp_seq=2 Destination Net Unreachable
^C
--- 10.66.122.194 ping statistics ---
2 packets transmitted, 0 received, +2 errors, 100% packet loss, time 1002ms

user@Kuber-Puper-User:~$ ping 10.66.207.66
PING 10.66.207.66 (10.66.207.66) 56(84) bytes of data.
From 10.4.44.0 icmp_seq=1 Destination Net Unreachable
From 10.4.44.0 icmp_seq=2 Destination Net Unreachable
^C
The switch tells us it has no idea where to send the traffic. The switch isn’t lying, that’s exactly the case — remember, there’s no route in the underlay:
Leaf-3#show ip ro 10.66.122.194


Leaf-3#show ip ro 10.66.207.66


***** Here's all that exists:
Leaf-3#show ip ro

Gateway of last resort is not set

 O        10.0.11.0/31 [110/30] via 10.33.99.0, Ethernet1
 O        10.1.11.0/31 [110/30] via 10.33.99.0, Ethernet1
 O        10.2.22.0/31 [110/30] via 10.33.99.0, Ethernet1
 C        10.3.33.0/31 is directly connected, Ethernet2
 C        10.4.44.0/31 is directly connected, Ethernet3
 O        10.11.99.0/31 [110/20] via 10.33.99.0, Ethernet1
 O        10.22.99.0/31 [110/20] via 10.33.99.0, Ethernet1
 C        10.33.99.0/31 is directly connected, Ethernet1
Meanwhile, the pods can still see each other:
user@k-w1:~$ kubectl exec -it test-pod -- sh

/ # ping 10.66.207.66
PING 10.66.207.66 (10.66.207.66): 56 data bytes
64 bytes from 10.66.207.66: seq=0 ttl=62 time=0.822 ms
64 bytes from 10.66.207.66: seq=1 ttl=62 time=0.808 ms
^C
--- 10.66.207.66 ping statistics ---
2 packets transmitted, 2 packets received, 0% packet loss
round-trip min/avg/max = 0.808/0.815/0.822 ms
Changing the Subnet Mask for Pod Networks
Let me remind you that IP pools are described by objects of type IPPools. Let’s see what objects we have:
user@K-Master:~$ kubectl get ippools
NAME                  AGE
default-ipv4-ippool   9d
Some default one. Let’s get more details (filter by the spec section — that’s where the essence is):
user@K-Master:~$ kubectl get ippools -o json | jq '.items[0].spec'
{
  "allowedUses": [
    "Workload",
    "Tunnel"
  ],
  "blockSize": 26,
  "cidr": "10.66.0.0/16",
  "ipipMode": "Always",
  "natOutgoing": true,
  "nodeSelector": "all()",
  "vxlanMode": "Never"
}
Aha, so at this stage, we need to create a new IPPool, change the mask in it, and somehow tell the nodes to use the new pool. I’ll create a YAML file like this:
apiVersion: projectcalico.org/v3
kind: IPPool
metadata:
  name: new-ippool-24
spec:
  cidr: 10.66.0.0/16
  blockSize: 24         # Change block size
  natOutgoing: true     # Keep NAT yet
  ipipMode: Always      # Keep tunnels yet
  nodeSelector: all()
This, by the way, seems to be our first MANIFEST — a solemn act of the Kubernetes administrator, informing the nodes of the issuance of laws of extreme importance or particularly significant events in Kubernetes (https://kubernetes.io/docs/concepts/workloads/management/)
Let’s apply the manifest with this command, enriching the output with diagnostics:
kubectl apply -f NewWonderfulIPPool -v=6
user@K-Master:~$ kubectl apply -f NewWonderfulIPPool -v=6
I0811 05:12:04.944183  517662 loader.go:395] Config loaded from file:  /home/user/.kube/config
I0811 05:12:05.000107  517662 round_trippers.go:553] GET https://10.0.11.1:6443/openapi/v2?timeout=32s 200 OK in 54 milliseconds
I0811 05:12:05.086473  517662 round_trippers.go:553] GET https://10.0.11.1:6443/openapi/v3?timeout=32s 200 OK in 2 milliseconds
I0811 05:12:05.092453  517662 round_trippers.go:553] GET https://10.0.11.1:6443/openapi/v3/apis/crd.projectcalico.org/v1?hash=F43628490716A6E186AC29F7729CFA9CA0B163FD10DE74A6B6E2BF9F05F3E2B12896E1B7EE2B009151FC11D1C697F0DB73483BF1AC7DD8C1E097532557302D58&timeout=32s 200 OK in 4 milliseconds
I0811 05:12:05.124300  517662 round_trippers.go:553] GET https://10.0.11.1:6443/apis/crd.projectcalico.org/v1/ippools/new-wonderful-pool 200 OK in 4 milliseconds
ippool.crd.projectcalico.org/new-wonderful-pool unchanged
I0811 05:12:05.128478  517662 apply.go:535] Running apply post-processor function
Okay, seems like everything is fine. Our pool appeared in the list of pools:
user@K-Master:~$ kubectl get ippools
NAME                  AGE
default-ipv4-ippool   9d
new-wonderful-pool    31s
But the block distribution hasn’t changed; the blocks are old:
user@K-Master:~$ kubectl get blockaffinities -o json | jq '.items[].spec'
{
  "cidr": "10.66.73.128/26",
  "deleted": "false",
  "node": "k-master",
  "state": "confirmed"
}
{
  "cidr": "10.66.207.64/26",
  "deleted": "false",
  "node": "k-w1",
  "state": "confirmed"
}
{
  "cidr": "10.66.53.192/26",
  "deleted": "false",
  "node": "k-w2",
  "state": "confirmed"
}
{
  "cidr": "10.66.122.192/26",
  "deleted": "false",
  "node": "k-w3",
  "state": "confirmed"
}
Well, in general, Kube follows a simple principle here: “If it works, don’t touch it!” Why change something if it’s already working? The addresses are still the same, pings work:
abap
user@k-w1:~$ kubectl get pods -A \
  -o custom-columns="NAMESPACE:.metadata.namespace,NAME:.metadata.name,IP:.status.podIP" \
  --no-headers \
  | grep -E "test-pod|calico-kube"

default       test-pod                                   10.66.122.194
kube-system   calico-kube-controllers-658d97c59c-kq2ld   10.66.207.66
According to advice from Google, I need to add the key-value disabled: true, вот так:
kubectl patch ippool default-ipv4-ippool --type='merge' -p '{"spec":{"disabled":true}}'
After the pool is “patched,” logically it should no longer be used.
Let’s kill the test-pod, create it again, and see what happens:
user@k-w1:~$ kubectl delete pod test-pod
pod "test-pod" deleted

user@k-w1:~$ kubectl run test-pod --image=alpine --restart=Never --rm -it -- ip a | grep inet
    inet 127.0.0.1/8 scope host lo
    inet6 ::1/128 scope host
    inet 10.66.53.196/32 scope global eth0
    inet6 fe80::4490:81ff:fecd:4c55/64 scope link
For now, it got an IP from the old block Okay, let’s take drastic measures and kill our Calico controller:
# Where is it
user@K-Master:~$ kubectl get pods -n kube-system | grep calico
calico-kube-controllers-658d97c59c-kq2ld   1/1     Running   0          10d
calico-node-b2rgf                          1/1     Running   0          10d
calico-node-lfbfg                          1/1     Running   0          10d
calico-node-ncqcp                          1/1     Running   0          10d
calico-node-wpw78                          1/1     Running   0          10d
user@K-Master:~$
user@K-Master:~$
user@K-Master:~$ kubectl delete pod calico-kube-controllers-658d97c59c-kq2ld
Error from server (NotFound): pods "calico-kube-controllers-658d97c59c-kq2ld" not found
user@K-Master:~$ kubectl delete pod calico-kube-controllers-658d97c59c-kq2ld -n kube-system
pod "calico-kube-controllers-658d97c59c-kq2ld" deleted
Surprisingly, after death, it immediately came back to life:
user@K-Master:~$ kubectl get pods -n kube-system | grep calico-kube-controllers
calico-kube-controllers-658d97c59c-pk8wx   1/1     Running   0          29s
Actually, it’s not surprising at all, because our controller isn’t just a pod — it’s a full-fledged Deployment:
user@K-Master:~$ kubectl get deployments -n kube-system
NAME                      READY   UP-TO-DATE   AVAILABLE   AGE
calico-kube-controllers   1/1     1            1           10d
coredns                   2/2     2            2           13d
See, there are two of them here—something about DNS and our controller. In very brief terms, a Deployment is an abstraction over pods that manages their lifecycle… Well, actually, a Deployment is an abstraction over a ReplicaSet, which is itself an abstraction over pods. I tell Kube: I want my application to live as 10 instances (after all, one of Kubernetes’ advantages is scalability) — and the ReplicaSet makes that happen. And a Deployment manages the ReplicaSet more intelligently (orchestrating the entire application release lifecycle).
If you’re the owner of Co-Co Pizza and make Margherita pizza, you need baker-pods — the stream of customers is endless, you need to make a lot of Margheritas, so you have 10 bakers. You need a foreman-baker (ReplicaSet) to keep an eye on things — if one baker burns in the oven and another drowns in tomato paste — you need to get two new bakers from the yellow bus. Then a crazy, disheveled chef bursts in with his latest genius idea and says, “Now we’re making Pepperoni! Here’s the recipe,” and runs off into the darkness. The entire production needs to be switched to Pepperoni — but you can’t stop making Margherita — customers are waiting, and the bakers don’t know how to make pepperoni yet, so you have to roll it out gradually — first one baker starts making pepperoni, then another, and so on (rolling update). At some point, the pizzeria customers realize the chef literally added shit to the pepperoni recipe and start complaining — you need to roll back to Margherita (rollback) — the Deployment manages this entire process.
So, what's up with our pizza Calico controller? Its Deployment is described like this:
user@K-Master:~$ kubectl describe deployment calico-kube-controllers -n kube-system
Name:               calico-kube-controllers
Namespace:          kube-system
CreationTimestamp:  Fri, 01 Aug 2025 10:57:23 +0000
Labels:             k8s-app=calico-kube-controllers
Annotations:        deployment.kubernetes.io/revision: 1
Selector:           k8s-app=calico-kube-controllers
Replicas:           1 desired | 1 updated | 1 total | 1 available | 0 unavailable
StrategyType:       Recreate
MinReadySeconds:    0
Pod Template:
  Labels:           k8s-app=calico-kube-controllers
  Service Account:  calico-kube-controllers
  Containers:
   calico-kube-controllers:
    Image:      docker.io/calico/kube-controllers:v3.25.0
    Port:       <none>
    Host Port:  <none>
    Liveness:   exec [/usr/bin/check-status -l] delay=10s timeout=10s period=10s #success=1 #failure=6
    Readiness:  exec [/usr/bin/check-status -r] delay=0s timeout=1s period=10s #success=1 #failure=3
    Environment:
      ENABLED_CONTROLLERS:  node
      DATASTORE_TYPE:       kubernetes
    Mounts:                 <none>
  Volumes:                  <none>
  Priority Class Name:      system-cluster-critical
Conditions:
  Type           Status  Reason
  ----           ------  ------
  Progressing    True    NewReplicaSetAvailable
  Available      True    MinimumReplicasAvailable
OldReplicaSets:  <none>
NewReplicaSet:   calico-kube-controllers-658d97c59c (1/1 replicas created)
Events:          <none>
In general, it’s important to remember that no matter how hard we try to kill pods, Kubernetes will always restore them to the number equal to the replicas value.
Okay, we reinstalled the controller. Let’s try to recreate the pod again:
user@k-w1:~$ kubectl run test-pod --image=alpine --restart=Never --rm -it -- ip a | grep inet
    inet 127.0.0.1/8 scope host lo
    inet6 ::1/128 scope host
    inet 10.66.122.197/32 scope global eth0
    inet6 fe80::487c:aaff:fe2b:3874/64 scope link
Still the same old story. kubectl get blockaffinities -o json | jq '.items[].spec' outputs the same old pools. Even the controller itself is still living in the old pool:
user@K-Master:~$ kubectl get pod -n kube-system -o wide | grep calico-kube-controllers
calico-kube-controllers-658d97c59c-pk8wx   1/1     Running   0          73m   10.66.53.197   k-w2       <none>           <none>
Hmm… Well, okay, let me try deleting the old pool entirely.
new-wonderful-pool    24h
user@k-w1:~$ kubectl delete ippool default-ipv4-ippool
ippool.crd.projectcalico.org "default-ipv4-ippool" deleted
user@k-w1:~$
user@k-w1:~$ kubectl get ippool
NAME                 AGE
new-wonderful-pool   24h
Doesn’t help. The blocks are all the same:
user@k-w1:~$ kubectl get blockaffinities -o json | jq '.items[].spec'
{
  "cidr": "10.66.73.128/26",
  "deleted": "false",
  "node": "k-master",
  "state": "confirmed"
}
{
  "cidr": "10.66.207.64/26",
  "deleted": "false",
  "node": "k-w1",
  "state": "confirmed"
}
{
  "cidr": "10.66.53.192/26",
  "deleted": "false",
  "node": "k-w2",
  "state": "confirmed"
}
{
  "cidr": "10.66.122.192/26",
  "deleted": "false",
  "node": "k-w3",
  "state": "confirmed"
But the blocks clearly have a mark saying they are not deleted — "deleted": "false" — and maybe they just need to be deleted? Well, okay:
user@k-w1:~$ kubectl delete blockaffinities --all -v=6
blockaffinity.crd.projectcalico.org "k-master-10-66-73-128-26" deleted
blockaffinity.crd.projectcalico.org "k-w1-10-66-207-64-26" deleted
blockaffinity.crd.projectcalico.org "k-w2-10-66-53-192-26" deleted
blockaffinity.crd.projectcalico.org "k-w3-10-66-122-192-26" deleted
Now I want to test — check if connectivity between pods remains. I try to see what addresses the pods have, but I see that my CNI controller has gone off somewhere and crashed.
user@k-w1:~$ kubectl get pods -o wide | grep calico-kube-controllers
NAMESPACE     NAME                                       READY   STATUS             RESTARTS        AGE   IP             NODE       NOMINATED NODE   READINESS GATES
kube-system   calico-kube-controllers-658d97c59c-kxtqc   0/1     CrashLoopBackOff   325 (53s ago)   21h   10.66.53.202   k-w2       <none>           <none>
There’s nothing particularly understandable in the logs — just that the controller can’t connect to the kubeapi. Though it’s not clear where it’s getting that IP for the kube-api, but that’s its problem.
user@k-w1:~$ kubectl logs -n kube-system -p calico-kube-controllers-658d97c59c-kxtqc
2025-08-13 03:52:49.481 [INFO][1] main.go 107: Loaded configuration from environment config=&config.Config{LogLevel:"info", WorkloadEndpointWorkers:1, ProfileWorkers:1, PolicyWorkers:1, NodeWorkers:1, Kubeconfig:"", DatastoreType:"kubernetes"}
W0813 03:52:49.483540       1 client_config.go:617] Neither --kubeconfig nor --master was specified.  Using the inClusterConfig.  This might not work.
2025-08-13 03:52:49.483 [INFO][1] main.go 131: Ensuring Calico datastore is initialized
2025-08-13 03:53:19.485 [ERROR][1] client.go 290: Error getting cluster information config ClusterInformation="default" error=Get "https://10.96.0.1:443/apis/crd.projectcalico.org/v1/clusterinformations/default": dial tcp 10.96.0.1:443: i/o timeout
2025-08-13 03:53:19.485 [INFO][1] main.go 138: Failed to initialize datastore error=Get "https://10.96.0.1:443/apis/crd.projectcalico.org/v1/clusterinformations/default": dial tcp 10.96.0.1:443: i/o timeout
2025-08-13 03:53:49.509 [ERROR][1] client.go 290: Error getting cluster information config ClusterInformation="default" error=Get "https://10.96.0.1:443/apis/crd.projectcalico.org/v1/clusterinformations/default": context deadline exceeded
2025-08-13 03:53:49.509 [INFO][1] main.go 138: Failed to initialize datastore error=Get "https://10.96.0.1:443/apis/crd.projectcalico.org/v1/clusterinformations/default": context deadline exceeded
2025-08-13 03:53:49.510 [FATAL][1] main.go 151: Failed to initialize Calico datastore
In general, it seems obvious here that we need to kill the controller once again and see what comes of it:
user@k-w1:~$ kubectl delete pod calico-kube-controllers-658d97c59c-kxtqc -n kube-system
pod "calico-kube-controllers-658d97c59c-kxtqc" delete
Did it work? Is everything working now? Seems like it, the pod is alive:
user@k-w1:~$ kubectl get pods -n kube-system
NAME                                       READY   STATUS    RESTARTS   AGE
calico-kube-controllers-658d97c59c-sjk2n   0/1     Running   0          23s
But actually — hell no, because 0/1 in the READY column. And after a while, we see the pod restarting:
NAME                                       READY   STATUS    RESTARTS        AGE
calico-kube-controllers-658d97c59c-sjk2n   0/1     Running   7 (5m34s ago)   15m
If you look at the pod description with kubectl describe pod calico-kube-controllers-658d97c59c-sjk2n -n kube-system, you can see various events, for example:
Events:
Type     Reason     Age                     From               Message

Normal   Scheduled  14m                     default-scheduler  Successfully assigned kube-system/calico-kube-controllers-658d97c59c-sjk2n to k-w3
Warning  Unhealthy  13m (x3 over 13m)       kubelet            Readiness probe failed: Error initializing datastore: Get "https://10.96.0.1:443/apis/crd.projectcalico.org/v1/clusterinformations/default": dial tcp 10.96.0.1:443: i/o timeout
Warning  Unhealthy  13m (x3 over 13m)       kubelet            Liveness probe failed: Error initializing datastore: Get "https://10.96.0.1:443/apis/crd.projectcalico.org/v1/clusterinformations/default": dial tcp 10.96.0.1:443: i/o timeout
Normal   Pulled     13m (x2 over 14m)       kubelet            Container image "docker.io/calico/kube-controllers:v3.25.0" already present on machine
Normal   Created    13m (x2 over 14m)       kubelet            Created container calico-kube-controllers
Normal   Started    13m (x2 over 14m)       kubelet            Started container calico-kube-controllers
Warning  Unhealthy  13m (x9 over 14m)       kubelet            Readiness probe failed: initialized to false
Warning  Unhealthy  12m (x3 over 13m)       kubelet            Liveness probe failed: initialized to false
Normal   Killing    12m                     kubelet            Container calico-kube-controllers failed liveness probe, will be restarted
Warning  BackOff    4m13s (x24 over 9m55s)  kubelet            Back-off restarting failed container calico-kube-controllers in pod calico-kube-controllers-658d97c59c-sjk2n_kube-system(fdf19539-da56-4c81-83bb-849d6da081eb
So, the pod restarts because the container liveness probe fails. A liveness probe is a sign that certain conditions for the pod to start working are met, and the pod can move on to the next check — the readiness probe (checking if it’s ready to accept traffic). In our pod’s description, there’s also this:
Liveness:       exec [/usr/bin/check-status -l] delay=10s timeout=10s period=10s #success=1 #failure=6
Readiness:      exec [/usr/bin/check-status -r] delay=0s timeout=1s period=10s #success=1 #failure=3
So, for Kube to understand that the pod is okay, the command /usr/bin/check-status -l must execute without errors (I suspect it should return code 0), but it seems to execute with an error, and from the logs, it’s clear that it can’t make the request Get "https://10.96.0.1:443/apis/crd.projectcalico.org/v1/clusterinformations/default".
What is this address anyway? Let me quote from the Kubernetes docs themselves and call it a day - The default Service, in this case, uses the ClusterIP 10.96.0.1, And what is this default Service? - The well-known kubernetes Service, that exposes the kube-apiserver endpoint to the Pods. In essence, 10.96.0.1 is the address that all pods use to communicate with the brain of the entire Kube—the kube-api. It’s a ClusterIP because the IP is shared across the entire cluster; there can be many masters in a cluster, and all are ready to accept traffic on this IP. How exactly a pod sends traffic to this address is a very murky matter, and if I start digging into it, I’ll need to postpone the release of this wonderful material for another couple of decades. Let’s try to figure it out later (no). In general, it’s clear now that to run the controller responsible for the network, we need a working network, the operation of which is provided by the controller. But do we really need the controller for the dataplane to work? What about the network nodes themselves?
Nothing good there either:
user@K-Master:~$ kubectl get pods -n kube-system -o wide | grep calico
calico-kube-controllers-658d97c59c-jz69l   0/1     CrashLoopBackOff   16 (70s ago)   49m   10.66.217.0    k-w2       <none>           <none>
calico-node-5k5bk                          0/1     Running            0              46h   10.1.11.1      k-w1       <none>           <none>
calico-node-cr77p                          0/1     Running            0              46h   10.2.22.1      k-w2       <none>           <none>
calico-node-mvrbb                          0/1     Running            0              46h   10.0.11.1      k-master   <none>           <none>
calico-node-w9m5m                          0/1     Running            0              46h   10.3.33.1      k-w3       <none>           <none>
No one is ready for anything :( The pod description shows that the readiness check is failing:
Events:
  Type     Reason     Age                     From     Message
  ----     ------     ----                    ----     -------
  Warning  Unhealthy  4m6s (x18714 over 46h)  kubelet  (combined from similar events): Readiness probe failed: 2025-08-14 04:29:04.978 [INFO][2834665] confd/health.go 180: Number of node(s) with BGP peering established = 3
calico/node is not ready: felix is not ready: readiness probe reporting 503
Seems like something with BGP, but it’s not obvious. So, let’s kill them all to be safe, and they will recover—since they are managed by a DaemonSet - this is a type of workload distribution that should be running one instance on each node. And Kube monitors this. Here’s how we kill them, just select all pods that have the label indicating they are calico-nodes:
user@K-Master:~$ kubectl delete pods -n kube-system -l k8s-app=calico-node
pod "calico-node-5k5bk" deleted
pod "calico-node-cr77p" deleted
pod "calico-node-mvrbb" deleted
pod "calico-node-w9m5m" deleted
TLDR - that didn’t help either. The nodes recovered, but no real connectivity appeared :( Here I lost my temper and decided to go to wor — I seemed to be spending too much emotional energy on what seemed like a simple task — changing the mask for pod CIDRs. While driving, I had the following logical chain: the network doesn’t work because the controller doesn’t work properly; the controller doesn’t work because it can’t connect to the Kube API; it can’t connect because the calico-nodes aren’t ready at all. Maybe we should try placing the controller itself in close proximity to the Kube API — right on the master—maybe being there, it won’t need to build any overlays and through some internal mechanisms it will be able to reach the kube api and tell everyone else how to live? A couple of days later, returning to writing the article, I found my lab non-functional because the virtual HDD space on PNETLAB was completely eaten up — the files of this lab in the /opt/unetlab/tmp folder took up a whopping 70G of some shit, halting all work. So, I had to shut down the nodes to clean up space. And you know what happened next… Remember this guy?

Probably the Universe heard my subconscious desire not to deal with all this calico crap and ate up all the hard drive space, forcing me to restart the lab. After restarting the nodes, the controller miraculously comes back to life and doesn’t crash.
user@K-Master:~$ kubectl get pods -n kube-system | grep calico-kube-controllers
calico-kube-controllers-658d97c59c-pfstc   1/1     Running   427 (4d18h ago)   5d23h
The blocks were allocated correctly:
user@K-Master:~$  kubectl get blockaffinities -o json | jq '.items[].spec'
{
  "cidr": "10.66.111.0/24",
  "deleted": "false",
  "node": "k-master",
  "state": "confirmed"
}
{
  "cidr": "10.66.95.0/24",
  "deleted": "false",
  "node": "k-w1",
  "state": "confirmed"
}
{
  "cidr": "10.66.217.0/24",
  "deleted": "false",
  "node": "k-w2",
  "state": "confirmed"
}
{
  "cidr": "10.66.52.0/24",
  "deleted": "false",
  "node": "k-w3",
  "state": "confirmed"
}
And even the controller itself got an IP from the correct block:
user@K-Master:~$ kubectl get pods -n kube-system -o wide | grep calico-kube-controllers
calico-kube-controllers-658d97c59c-pfstc   1/1     Running   427 (4d18h ago)   5d23h   10.66.52.3   k-w3       <none>           <none>
Each node has a set of routes like this, received via bird:
user@k-w3:~$  ip r | grep bird
blackhole 10.66.52.0/24 proto bird
10.66.95.0/24 via 10.0.137.15 dev ens5 proto bird
10.66.111.0/24 via 10.0.137.12 dev ens5 proto bird
10.66.217.0/24 via 10.0.137.112 dev ens5 proto bird
And if you go inside some bird, you can see that sessions are established and routes are received:
user@k-w3:~$ kubectl exec -it calico-node-9gl6c  -n kube-system -- sh
Defaulted container "calico-node" out of: calico-node, upgrade-ipam (init), install-cni (init), mount-bpffs (init)
sh-4.4#  birdcl show protocols | grep BGP
Mesh_10_0_137_12 BGP      master   up     03:52:40    Established
Mesh_10_0_137_15 BGP      master   up     03:52:40    Established
Mesh_10_0_137_112 BGP      master   up     03:52:40    Established


sh-4.4#  birdcl show route
BIRD v0.3.3+birdv1.6.8 ready.
10.0.0.0/8         via 10.3.33.0 on ens3 [kernel1 03:52:39] * (10)
10.3.33.0/31       dev ens3 [direct1 03:52:38] * (240)
10.66.52.0/24      blackhole [static1 03:52:38] * (200)
10.66.52.3/32      dev cali718083fb40c [kernel1 03:52:40] * (10)
10.66.95.0/24      via 10.0.137.15 on ens5 [Mesh_10_0_137_15 03:52:40] * (100/0) [i]
10.66.111.0/24     via 10.0.137.12 on ens5 [Mesh_10_0_137_12 03:52:40] * (100/0) [i]
10.0.137.0/24      dev ens5 [direct1 03:52:38] * (240)
10.66.217.0/24     via 10.0.137.112 on ens5 [Mesh_10_0_137_112 03:52:40] * (100/0) [i]
Seems like the control plane is okay. Is the dataplane working? Can pods on different nodes communicate with each other? Let’s run alpine:
user@K-Master:~$ kubectl run test-pod --image=alpine --restart=Never --rm -it -- sh
If you don't see a command prompt, try pressing enter.
/ # ip a
1: lo: <LOOPBACK,UP,LOWER_UP> mtu 65536 qdisc noqueue state UNKNOWN qlen 1000
    link/loopback 00:00:00:00:00:00 brd 00:00:00:00:00:00
    inet 127.0.0.1/8 scope host lo
       valid_lft forever preferred_lft forever
    inet6 ::1/128 scope host
       valid_lft forever preferred_lft forever
3: eth0@if5: <BROADCAST,MULTICAST,UP,LOWER_UP,M-DOWN> mtu 1500 qdisc noqueue state UP
    link/ether b6:21:46:c9:bf:a2 brd ff:ff:ff:ff:ff:ff
    inet 10.66.217.2/32 scope global eth0
       valid_lft forever preferred_lft forever
    inet6 fe80::b421:46ff:fec9:bfa2/64 scope link
       valid_lft forever preferred_lft forever
Judging by the IP, this is worker two, but you can also check like this:
user@k-w1:~$ kubectl get pods -n kube-system -o wide | grep test-pod
test-pod       1/1     Running   0    2m5s    10.66.217.2   k-w2       <none>           <none>
And we can try to ping the same controller on worker three — 10.66.52.3:
/ # ping 10.66.52.3
PING 10.66.52.3 (10.66.52.3): 56 data bytes
64 bytes from 10.66.52.3: seq=0 ttl=62 time=1.224 ms
64 bytes from 10.66.52.3: seq=1 ttl=62 time=0.410 ms
64 bytes from 10.66.52.3: seq=2 ttl=62 time=0.420 ms
Well, okay. Grudgingly, it seems the task of “changing the mask for pod networks” is solved. I suspect that to implement the next stage of my plan, the disk space will have to run out again.
Peering with the Underlay, Creating a Flat Network Without Overlay
In general, I don’t understand or know what to do here in detail from the Kube side :( I have no friends who are experts in Calico, and the official documentation won’t open from my computer:
Well, we’ll just have to talk to AI then! I tried DeepSeek, GPT-4, Claude 4, and Grok 4. Claude seemed the most adequate to me — it drafted a basic plan for me, asked for additional diagnostics, and asked clarifying questions. We planned out the AS numbers and made a detailed plan of what to do. I won’t show my correspondence with it (that’s personal), but I’ll just try to do everything as we agreed. The picture I ended up with for AS number distribution looked like this:
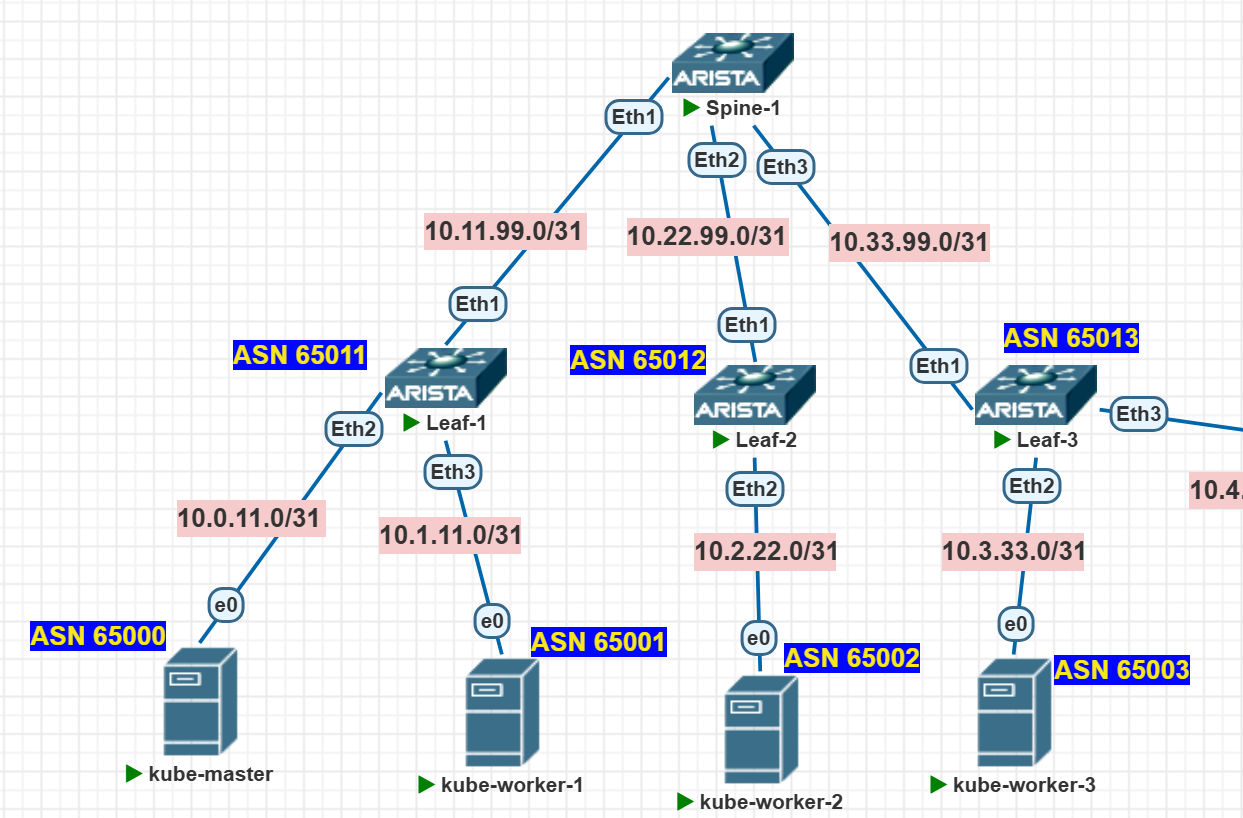
But first, let’s relocate the controller
Before starting the critical work, I intuitively couldn’t shake the thought of moving the calico-controller to the master, so that in case of connectivity loss, it could somehow sort out its own problems there. Claude confirmed that this was a good idea, but it probably, like all AIs, was just flattering me. This is suggested to be done by adding a so-called nodeSelector to the specification of my Deployment — the name pretty much says what it does — it selects a node).
It’s suggested to add this patch:
  "spec": {
    "template": {
      "spec": {
        "nodeSelector": {
          "kubernetes.io/os": "linux",
          "node-role.kubernetes.io/control-plane": ""
        },
        "tolerations": [
          {
            "key": "CriticalAddonsOnly",
            "operator": "Exists"
          },
          {
            "key": "node-role.kubernetes.io/control-plane",
            "operator": "Exists",
            "effect": "NoSchedule"
          },
          {
            "key": "node-role.kubernetes.io/master",
            "operator": "Exists",
            "effect": "NoSchedule"
          }
        ]
      }
    }
  }
}'
A bit more explanation: we’re not only adding the nodeSelectorsection, explicitly stating we want to place the pod on the master - "node-role.kubernetes.io/control-plane", but we’re also specifying some tolerations. What are those? It’s just the concept of prohibiting workload placement on certain nodes (taints) and, SURPRISINGLY, bypassing these prohibitions (tolerations). You can read more about it here: https://kubernetes.io/docs/concepts/scheduling-eviction/taint-and-toleration/
Why do we need this? Because by default, all Kube masters live with this taint:
user@K-Master:~$ kubectl describe node k-master | grep Taints -A 3
Taints:             node-role.kubernetes.io/control-plane:NoSchedule
Which means “Don’t place anything here at all!!1”. This is the taint we bypass with constructs like this:
          {
            "key": "node-role.kubernetes.io/control-plane",
            "operator": "Exists",
            "effect": "NoSchedule"
          }
Which means — “If the control-plane node tells you ‘Don’t place anything here at all!!1’, just ignore it.” And that’s exactly what we need!
So, let’s try it via kubectl patch deployment calico-kube-controllers -n kube-system -p [The patch text here]:
It was like this:
user@K-Master:~$ kubectl get pods -n kube-system -l k8s-app=calico-kube-controllers -o wide
NAME                                       READY   STATUS    RESTARTS          AGE     IP           NODE   NOMINATED NODE   READINESS GATES
calico-kube-controllers-658d97c59c-pfstc   1/1     Running   427 (5d18h ago)   6d23h   10.66.52.3   k-w3   <none>           <none>
Now it’s like this:
user@K-Master:~$ kubectl get pods -n kube-system -l k8s-app=calico-kube-controllers -o wide
NAME                                       READY   STATUS    RESTARTS   AGE     IP            NODE       NOMINATED NODE   READINESS GATES
calico-kube-controllers-6c879b76df-f5f44   1/1     Running   0          2m40s   10.66.111.1   k-master   <none>           <none>
The controller moved, the IP changed, and connectivity remains from a randomly created pod:
user@K-Master:~$ kubectl run test-pod --image=alpine --restart=Never --rm -it -- ip -a & ping 10.66.111.1
[1] 1828972
PING 10.66.111.1 (10.66.111.1) 56(84) bytes of data.
64 bytes from 10.66.111.1: icmp_seq=1 ttl=64 time=1.59 ms
64 bytes from 10.66.111.1: icmp_seq=2 ttl=64 time=0.030 ms
64 bytes from 10.66.111.1: icmp_seq=3 ttl=64 time=0.047 ms
Okay, let’s move on. First, I’ll do a basic BGP configuration on the switches towards the nodes and set up redistribution into the OSPF process so it goes to the spines:
*===  Leaf-1  ===*
  router bgp 65011
    neighbor 10.0.11.1 remote-as 65000
    neighbor 10.1.11.1 remote-as 65001
    !
    address-family ipv4
        neighbor 10.0.11.1 activate
        neighbor 10.1.11.1 activate
  router ospf 1
    redistribute bgp

*===  Leaf-2  ===*
  router bgp 65012
    neighbor 10.2.22.1 remote-as 65002
    !
    address-family ipv4
        neighbor 10.2.22.1 activate
  router ospf 1
    redistribute bgp

*===  Leaf-3  ===*
  router bgp 65013
    neighbor 10.3.33.1 remote-as 65003
    !
    address-family ipv4
        neighbor 10.3.33.1 activate
  router ospf 1
    redistribute bgp
Here’s our plan for further actions:
- Create a global BGP configuration
- Modify Calico objects of type Node
- Create specific instructions for each node on who to peer with.
- Dismantle the default full-mesh and disable tunnels.
- ???
- PROFIT!
Global BGP Configuration
Right now, such an entity doesn’t actually exist. This command shows nothing:
user@K-Master:~$ calicoctl get bgpconfig
NAME   LOGSEVERITY   MESHENABLED   ASNUMBER

user@K-Master:~$
Meanwhile, BGP sessions are established — each node with every other:
user@K-Master:~$ sudo calicoctl node status

IPv4 BGP status
+--------------+-------------------+-------+------------+-------------+
| PEER ADDRESS |     PEER TYPE     | STATE |   SINCE    |    INFO     |
+--------------+-------------------+-------+------------+-------------+
| 10.0.137.15  | node-to-node mesh | up    | 2025-08-20 | Established |
| 10.0.137.112 | node-to-node mesh | up    | 2025-08-20 | Established |
| 10.0.137.142 | node-to-node mesh | up    | 2025-08-20 | Established |
+--------------+-------------------+-------+------------+-------------+
This is some default Calico behavior—upon startup, magical auto-discovery happens, and they peer with each other via iBGP in the default AS 64512.
I’ll create a new object of type bgpconfig via a YAML file with this content:
apiVersion: projectcalico.org/v3
kind: BGPConfiguration
metadata:
  name: default
spec:
  logSeverityScreen: Info
  nodeToNodeMeshEnabled: true  #  Leaving mesh enabled for now
  asNumber: 65000  # Default AS, but each node will have its own
  serviceClusterIPs:
  - cidr: 10.96.0.0/12  # Standard CIDR for k8s services
user@K-Master:~$ calicoctl apply -f bgp-config.yaml
Successfully applied 1 'BGPConfiguration' resource(s)
Now the command output shows that I have some BGP configuration:
user@K-Master:~$ calicoctl get bgpconfig
NAME      LOGSEVERITY   MESHENABLED   ASNUMBER
default   Info          true          65000
At this stage, nothing should break—the sessions remain up.
Editing Calico Node Objects
Now here I think something might break. The AI suggests patching the current objects, adding this to the spec (using the master as an example):
apiVersion: projectcalico.org/v3
kind: Node
metadata:
  name: k-master
spec:
  bgp:
    asNumber: 65000
    ipv4Address: 10.0.11.1/31
If we look at the current state of the object now, it’s like this:
user@K-Master:~$ calicoctl get node k-master -o yaml | grep spec -A 100
spec:
  addresses:
  - address: 10.0.137.12/24
    type: CalicoNodeIP
  - address: 10.0.11.1
    type: InternalIP
  bgp:
    ipv4Address: 10.0.137.12/24
    ipv4IPIPTunnelAddr: 10.66.111.0
  orchRefs:
  - nodeName: k-master
    orchestrator: k8s
status:
  podCIDRs:
  - 10.66.0.0/24
So here we’re changing ipv4Address: 10.0.137.12 to ipv4Address: 10.0.11.1/31. Remember, Calico didn’t ask me initially and chose addresses convenient for it to build BGP. In my opinion, everything should fall apart. Well, let’s test it.
Let’s apply the proposed config for the k-master:
user@K-Master:~$ calicoctl apply -f node-k-master-bgp.yaml
Successfully applied 1 'Node' resource(s)
What happened? Well, firstly, the node specification changed as expected:
user@K-Master:~$  calicoctl get node k-master -o yaml | grep spec -A 100
spec:
  addresses:
  - address: 10.0.11.1/31
    type: CalicoNodeIP
  - address: 10.0.11.1
    type: InternalIP
  bgp:
    asNumber: 65000
    ipv4Address: 10.0.11.1/31
  orchRefs:
  - nodeName: k-master
    orchestrator: k8s
It’s worth noting here that not only the ipv4Address parameter in the BGP section changed, but also the CalicoNodeIP address - it also changed to 10.0.11.1. Well, okay, Calico knows best.
Connectivity, as I expected, broke. The controller is not accessible from the test pod:
user@k-w2:~$ kubectl run test-pod1 --image=alpine --restart=Never --rm -it -- ip a && ping 10.66.111.1
3: eth0@if15: <BROADCAST,MULTICAST,UP,LOWER_UP,M-DOWN> mtu 1500 qdisc noqueue state UP
    link/ether 02:a9:74:b1:03:bd brd ff:ff:ff:ff:ff:ff
    inet 10.66.95.11/32 scope global eth0
       valid_lft forever preferred_lft forever
    inet6 fe80::a9:74ff:feb1:3bd/64 scope link tentative
       valid_lft forever preferred_lft forever
pod "test-pod1" deleted
PING 10.66.111.1 (10.66.111.1) 56(84) bytes of data.
From 10.2.22.0 icmp_seq=1 Destination Net Unreachable
From 10.2.22.0 icmp_seq=2 Destination Net Unreachable
From 10.2.22.0 icmp_seq=3 Destination Net Unreachable
From 10.2.22.0 icmp_seq=4 Destination Net Unreachable
Meanwhile, BGP is still UP!
user@K-Master:~$  sudo calicoctl node status
Calico process is running.

IPv4 BGP status
+--------------+-------------------+-------+----------+-------------+
| PEER ADDRESS |     PEER TYPE     | STATE |  SINCE   |    INFO     |
+--------------+-------------------+-------+----------+-------------+
| 10.0.137.15  | node-to-node mesh | up    | 04:30:59 | Established |
| 10.0.137.112 | node-to-node mesh | up    | 04:30:59 | Established |
| 10.0.137.142 | node-to-node mesh | up    | 04:30:59 | Established |
+--------------+-------------------+-------+----------+-------------+
And if you look from any worker’s side, you can see that BGP built to the new IP:
user@k-w1:~$ sudo calicoctl node status

IPv4 BGP status
+--------------+-------------------+-------+----------+-------------+
| PEER ADDRESS |     PEER TYPE     | STATE |  SINCE   |    INFO     |
+--------------+-------------------+-------+----------+-------------+
| 10.0.137.112 | node-to-node mesh | up    | 04:16:40 | Established |
| 10.0.137.142 | node-to-node mesh | up    | 04:16:40 | Established |
| 10.0.11.1    | node-to-node mesh | up    | 04:30:59 | Established |
+--------------+-------------------+-------+----------+-------------+
From the bird’s perspective on the worker, the situation is similar — we see BGP to the new neighbor.
sh-4.4#  birdcl show protocols | grep BGP
Mesh_10_0_137_112 BGP      master   up     04:16:40    Established
Mesh_10_0_137_142 BGP      master   up     04:16:40    Established
Mesh_10_0_11_1 BGP      master   up     04:30:59    Established
The uptime is a bit confusing, but oh well. Let’s assume it’s a bird-specific thing and changing a neighbor’s IP doesn’t count as a new neighbor )) What’s interesting is that before doing all this, I started a dump on this interface:
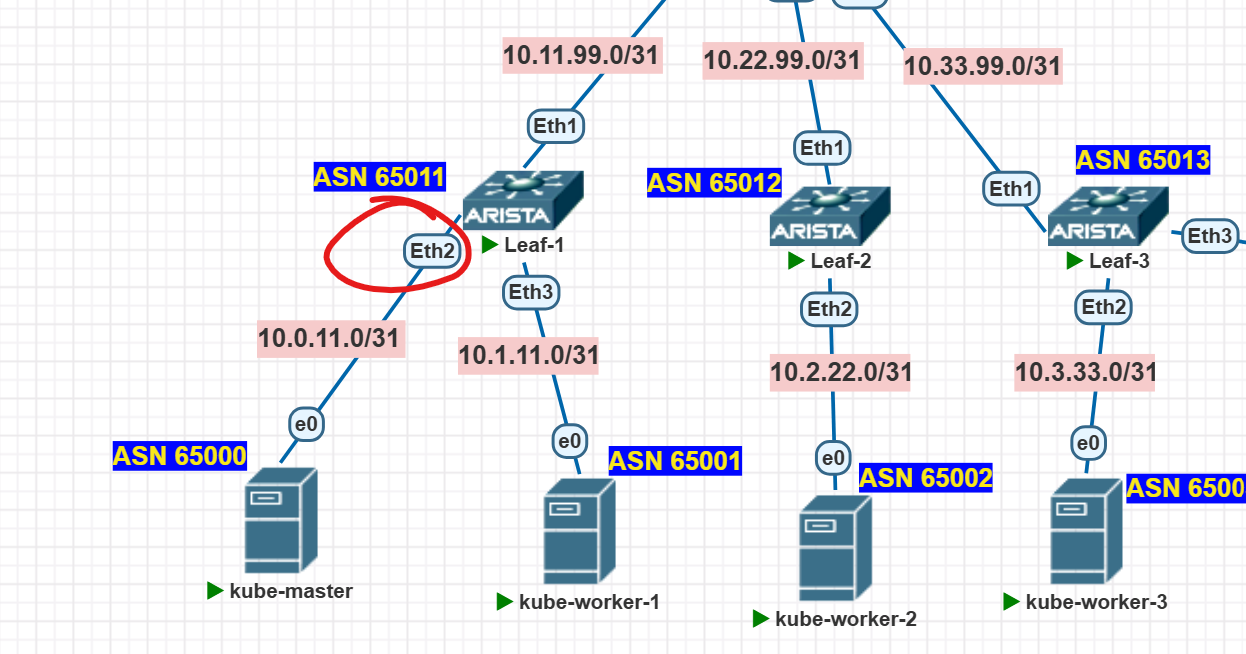
And I saw a full establishment of a new BGP session from the first worker, for example:
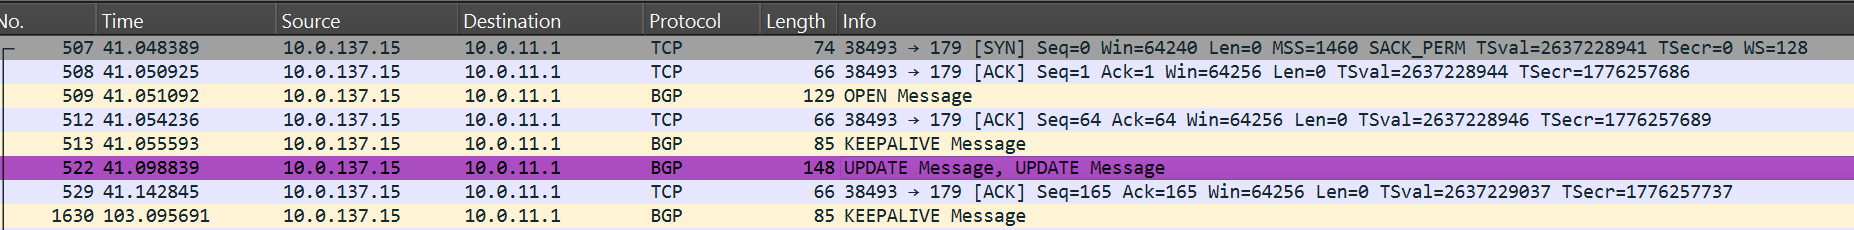
No return packets are visible because, according to the routing, packets to 10.0.137.15 will go through the interface hacked in for Internet access. The important thing here is the fact itself — Calico told all other nodes that the master’s IP changed and now BGP needs to be built to the new address.
Our tunnels fell apart; there’s no connectivity between pods. I don’t really want to figure out why—I’ll go off researching for another couple of weeks, and I really want to finish this article! So, right now our network is in a somewhat disassembled state, and we need to fix it ASAP! Let’s apply these configs for the remaining node
# k-w1 (AS 65001)
cat << EOF > node-k-w1-bgp.yaml
apiVersion: projectcalico.org/v3
kind: Node
metadata:
  name: k-w1
spec:
  bgp:
    asNumber: 65001
    ipv4Address: 10.1.11.1/31
EOF

# k-w2 (AS 65002)
cat << EOF > node-k-w2-bgp.yaml
apiVersion: projectcalico.org/v3
kind: Node
metadata:
  name: k-w2
spec:
  bgp:
    asNumber: 65002
    ipv4Address: 10.2.22.1/31
EOF

# k-w3 (AS 65003)
cat << EOF > node-k-w3-bgp.yaml
apiVersion: projectcalico.org/v3
kind: Node
metadata:
  name: k-w3
spec:
  bgp:
    asNumber: 65003
    ipv4Address: 10.3.33.1/31
EOF

# Применяем конфигурации

calicoctl apply -f node-k-w1-bgp.yaml
calicoctl apply -f node-k-w2-bgp.yaml
calicoctl apply -f node-k-w3-bgp.yaml
Boom, and everything built over the new addresses. Still a full mesh for now:
user@K-Master:~$ sudo calicoctl node status
Calico process is running.

IPv4 BGP status
+--------------+-------------------+-------+----------+-------------+
| PEER ADDRESS |     PEER TYPE     | STATE |  SINCE   |    INFO     |
+--------------+-------------------+-------+----------+-------------+
| 10.1.11.1    | node-to-node mesh | up    | 05:13:02 | Established |
| 10.2.22.1    | node-to-node mesh | up    | 05:13:02 | Established |
| 10.3.33.1    | node-to-node mesh | up    | 05:13:02 | Established |
+--------------+-------------------+-------+----------+-------------+
Connectivity is still gone. In my understanding, it should appear through tunnels — but God be its judge… Anyway, I couldn’t resist and not figure out why there’s no connectivity :( If you run a test pod and try to ping the controller’s address from it, you can see this:
user@k-w2:~$ kubectl run test-pod1 --image=alpine --restart=Never --rm -it -- ip a && ping 10.66.111.1
3: eth0@if16: <BROADCAST,MULTICAST,UP,LOWER_UP,M-DOWN> mtu 1500 qdisc noqueue state UP
    link/ether aa:7d:90:55:12:47 brd ff:ff:ff:ff:ff:ff
    inet 10.66.95.12/32 scope global eth0
       valid_lft forever preferred_lft forever
    inet6 fe80::a87d:90ff:fe55:1247/64 scope link tentative
       valid_lft forever preferred_lft forever
pod "test-pod1" deleted
PING 10.66.111.1 (10.66.111.1) 56(84) bytes of data.
From 10.2.22.0 icmp_seq=1 Destination Net Unreachable
From 10.2.22.0 icmp_seq=2 Destination Net Unreachable
From 10.2.22.0 icmp_seq=3 Destination Net Unreachable
From 10.2.22.0 icmp_seq=1 Destination Net Unreachable - the switch is telling us, “Hey, I can’t reach that network!”
When the master node established a BGP session to the second worker, it sent an Update like this, telling it about its network:
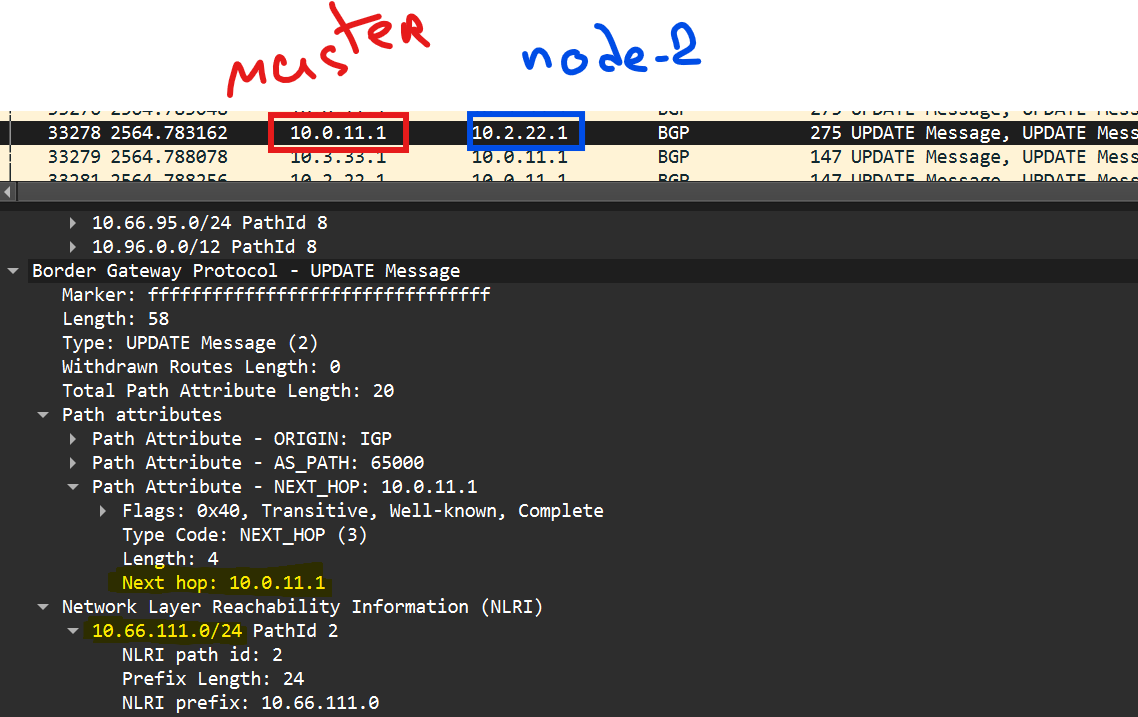
Basically — “If anything, girlfriend, for the network 10.66.111.0/24 the next-hop is 10.0.11.1”, which you can see, for example, in bird on the second node:
sh-4.4# birdcl show route 10.66.111.0/24 all
BIRD v0.3.3+birdv1.6.8 ready.
10.66.111.0/24     via 10.2.22.0 on ens3 [Mesh_10_0_11_1 05:13:02 from 10.0.11.1] * (100/?) [AS65000i]
  Type: BGP unicast univ
  BGP.origin: IGP
  BGP.as_path: 65000
  BGP.next_hop: 10.0.11.1
  BGP.local_pref: 100
But this means nothing. Which interface should the packet be sent to? Recursively resolving the next-hop, the node concludes that 10.66.111.0/24 via 10.2.22.0 on ens3, and sending the packet to the switch gets a big fat nothing in response because the switch has no clue about this network—no one has told it anything yet.
Leaf-2# show ip ro 10.66.111.1
Gateway of last resort is not set
Leaf-2#
This is why we need the third step—we need to peer the nodes with the switches and tell THEM about this network, not the neighbor nodes.
BGP with the Switches
We need to create Calico objects of type BGPPeer. They don’t exist right now:
user@K-Master:~$ calicoctl get bgppeer
NAME   PEERIP   NODE   ASN

user@K-Master:~$
We need them to exist. Well, if we need them, we need them. I create this YAML:
apiVersion: projectcalico.org/v3
kind: BGPPeer
metadata:
  name: k-master-to-switch
spec:
  peerIP: 10.0.11.0 # свитч
  asNumber: 65011  # его ASN
  nodeSelector: kubernetes.io/hostname == "k-master"
I apply it and get:
From the Kube side:
user@K-Master:~$ calicoctl get bgppeer
NAME                 PEERIP      NODE                                   ASN
k-master-to-switch   10.0.11.0   kubernetes.io/hostname == "k-master"   65011

* Session status:
user@K-Master:~$ sudo calicoctl node status
IPv4 BGP status
+--------------+-------------------+-------+----------+-------------+
| PEER ADDRESS |     PEER TYPE     | STATE |  SINCE   |    INFO     |
+--------------+-------------------+-------+----------+-------------+
| 10.1.11.1    | node-to-node mesh | up    | 05:13:02 | Established |
| 10.2.22.1    | node-to-node mesh | up    | 05:13:02 | Established |
| 10.3.33.1    | node-to-node mesh | up    | 05:13:02 | Established |
| 10.0.11.0    | node specific     | up    | 05:41:14 | Established |
+--------------+-------------------+-------+----------+-------------+
The session also came up on the switch side:
Leaf-1# show ip bgp summary | inc 10.0.11.1|Nei
Neighbor Status Codes: m - Under maintenance
  Neighbor  V AS           MsgRcvd   MsgSent  InQ OutQ  Up/Down State   PfxRcd PfxAcc
  10.0.11.1 4 65000            135       550    0    0 01:41:53 Estab   32     32
I’m receiving 32 prefixes, wow! What’s in there:
 * >      10.66.52.0/24          10.0.11.1             0       -          100     0       65000 65003 i
 *        10.66.52.0/24          10.0.11.1             0       -          100     0       65000 65001 65003 i
 *        10.66.52.0/24          10.0.11.1             0       -          100     0       65000 65002 65001 65003 i
 *        10.66.52.0/24          10.0.11.1             0       -          100     0       65000 65001 65002 65003 i
 *        10.66.52.0/24          10.0.11.1             0       -          100     0       65000 65002 65003 i
 * >      10.66.95.0/24          10.0.11.1             0       -          100     0       65000 65001 i
 *        10.66.95.0/24          10.0.11.1             0       -          100     0       65000 65003 65001 i
 *        10.66.95.0/24          10.0.11.1             0       -          100     0       65000 65002 65001 i
 *        10.66.95.0/24          10.0.11.1             0       -          100     0       65000 65003 65002 65001 i
 *        10.66.95.0/24          10.0.11.1             0       -          100     0       65000 65002 65003 65001 i
 * >      10.66.111.0/24         10.0.11.1             0       -          100     0       65000 i
 * >      10.66.217.0/24         10.0.11.1             0       -          100     0       65000 65002 i
 *        10.66.217.0/24         10.0.11.1             0       -          100     0       65000 65003 65002 i
 *        10.66.217.0/24         10.0.11.1             0       -          100     0       65000 65001 65003 65002 i
 *        10.66.217.0/24         10.0.11.1             0       -          100     0       65000 65003 65001 65002 i
 *        10.66.217.0/24         10.0.11.1             0       -          100     0       65000 65001 65002 i
 * >      10.96.0.0/12           10.0.11.1             0       -          100     0       65000 i
 *        10.96.0.0/12           10.0.11.1             0       -          100     0       65000 65003 65002 i
 *        10.96.0.0/12           10.0.11.1             0       -          100     0       65000 65003 65001 65002 i
 *        10.96.0.0/12           10.0.11.1             0       -          100     0       65000 65002 65001 65003 i
 *        10.96.0.0/12           10.0.11.1             0       -          100     0       65000 65001 65003 i
 *        10.96.0.0/12           10.0.11.1             0       -          100     0       65000 65001 i
 *        10.96.0.0/12           10.0.11.1             0       -          100     0       65000 65002 65003 i
 *        10.96.0.0/12           10.0.11.1             0       -          100     0       65000 65002 65003 65001 i
 *        10.96.0.0/12           10.0.11.1             0       -          100     0       65000 65002 65001 i
 *        10.96.0.0/12           10.0.11.1             0       -          100     0       65000 65001 65002 i
 *        10.96.0.0/12           10.0.11.1             0       -          100     0       65000 65001 65003 65002 i
 *        10.96.0.0/12           10.0.11.1             0       -          100     0       65000 65002 i
 *        10.96.0.0/12           10.0.11.1             0       -          100     0       65000 65003 i
 *        10.96.0.0/12           10.0.11.1             0       -          100     0       65000 65003 65002 65001 i
 *        10.96.0.0/12           10.0.11.1             0       -          100     0       65000 65001 65002 65003 i
 *        10.96.0.0/12           10.0.11.1             0       -          100     0       65000 65003 65001 i
Aha, this is the existing full-mesh sessions coming back to bite us. Bird on the master, instead of choosing one best route and sending it to us, is sending absolutely everything they’ve collected in their full-mesh. Out of all this, the only route that matters to us right now is this one:
Leaf-1#show ip ro 10.66.111.0

 B E      10.66.111.0/24 [200/0] via 10.0.11.1, Ethernet2
So, the master’s pod network has become routable in the Underlay. And now this connectivity should work:
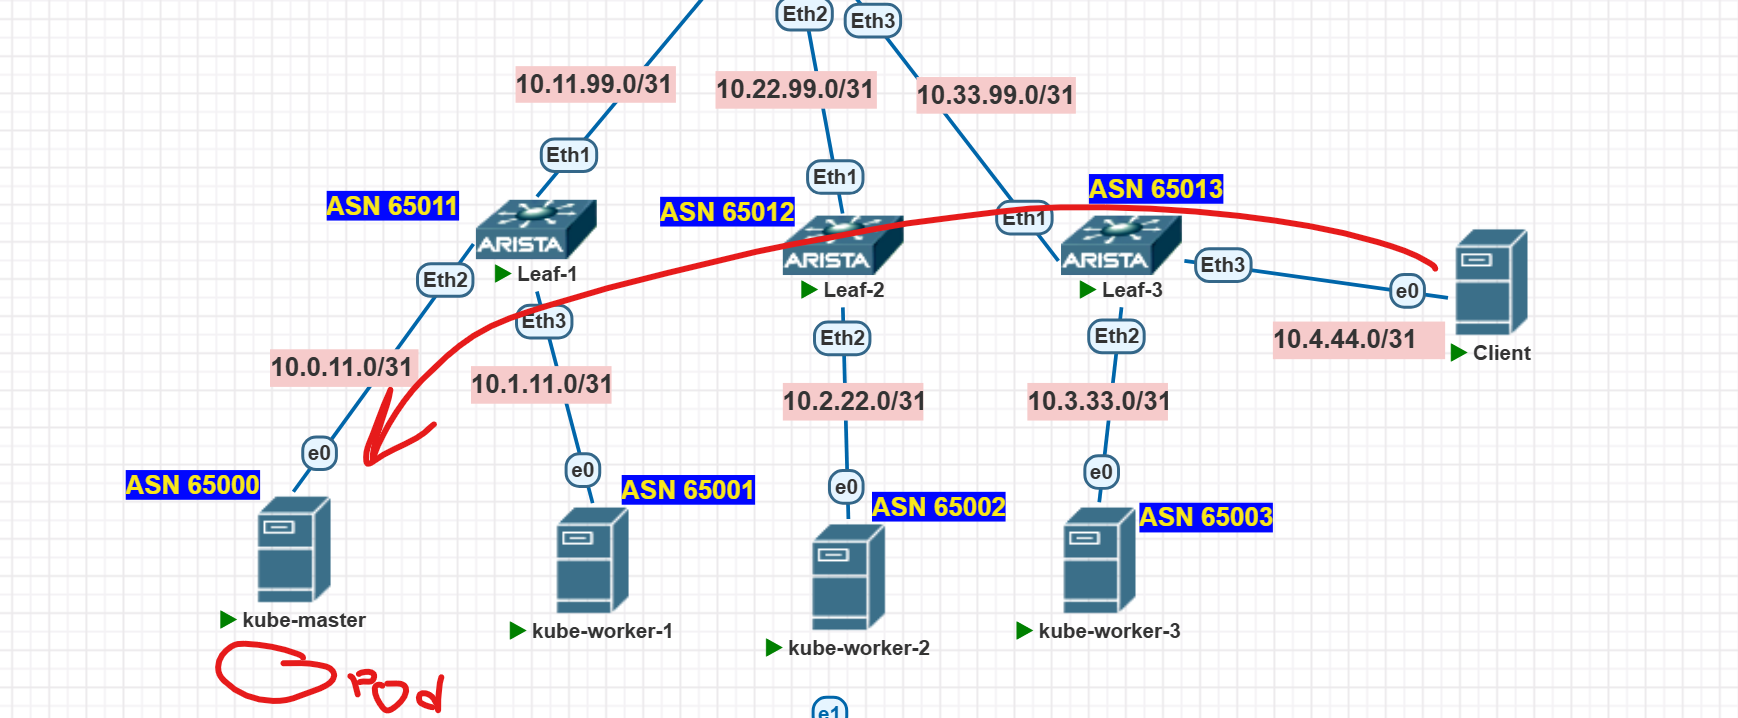
Remember, “Client” is just a Linux host connected to the underlay. Pings are working:
user@ubuntu:~$ ping 10.66.111.1
PING 10.66.111.1 (10.66.111.1) 56(84) bytes of data.
64 bytes from 10.66.111.1: icmp_seq=1 ttl=60 time=11.6 ms
64 bytes from 10.66.111.1: icmp_seq=2 ttl=60 time=13.0 ms
64 bytes from 10.66.111.1: icmp_seq=3 ttl=60 time=15.0 ms
The trace runs as it should:
user@ubuntu:~$ traceroute 10.66.111.1
traceroute to 10.66.111.1 (10.66.111.1), 30 hops max, 60 byte packets
 1  10.4.44.0 (10.4.44.0)  5.134 ms  5.174 ms  7.521 ms
 2  10.33.99.0 (10.33.99.0)  16.426 ms  16.529 ms  19.762 ms
 3  10.11.99.1 (10.11.99.1)  25.497 ms  25.656 ms  27.368 ms
 4  10.0.11.1 (10.0.11.1)  36.243 ms  36.421 ms  39.167 ms
 5  10.66.111.1 (10.66.111.1)  39.321 ms  42.110 ms  42.218 ms
For good measure, I’ll also place a simple web server right in the pod network on the master, like this:
user@K-Master:~$ cat web-on-master
apiVersion: v1
kind: Pod
metadata:
  name: test-web-master
  labels:
    app: test-web
spec:
  nodeSelector:
    kubernetes.io/hostname: k-master
  tolerations:
  - key: node-role.kubernetes.io/control-plane
    operator: Exists
    effect: NoSchedule
  - key: node-role.kubernetes.io/master
    operator: Exists
    effect: NoSchedule
  containers:
  - name: web
    image: nginx:alpine
    ports:
    - containerPort: 80
  restartPolicy: Always
Apply the manifest:
user@K-Master:~$ kubectl apply -f web-on-master
pod/test-web-master created
* чекаем под:
user@K-Master:~$ kubectl get pods -o wide | grep web
test-web-master                            1/1     Running   0              2m55s   10.66.111.2   k-master   <none>           <none>
Check accessibility from the Client:
user@ubuntu:~$ curl -s http://10.66.111.2
<!DOCTYPE html>
<html>
<head>
<title>Welcome to nginx!</title>
<style>
html { color-scheme: light dark; }
body { width: 35em; margin: 0 auto;
font-family: Tahoma, Verdana, Arial, sans-serif; }
</style>
</head>
<body>
<h1>Welcome to nginx!</h1>
<p>If you see this page, the nginx web server is successfully installed and
working. Further configuration is required.</p>

<p>For online documentation and support please refer to
<a href="http://nginx.org/">nginx.org</a>.<br/>
Commercial support is available at
<a href="http://nginx.com/">nginx.com</a>.</p>

<p><em>Thank you for using nginx.</em></p>
</body>
</html>
Awesome!
Let’s finish the peering on the remaining nodes:
# BGP peer для k-w1
cat << EOF > bgppeer-k-w1.yaml
apiVersion: projectcalico.org/v3
kind: BGPPeer
metadata:
  name: k-w1-to-switch
spec:
  peerIP: 10.1.11.0
  asNumber: 65011
  nodeSelector: kubernetes.io/hostname == "k-w1"
EOF

# BGP peer для k-w2
cat << EOF > bgppeer-k-w2.yaml
apiVersion: projectcalico.org/v3
kind: BGPPeer
metadata:
  name: k-w2-to-switch
spec:
  peerIP: 10.2.22.0
  asNumber: 65012
  nodeSelector: kubernetes.io/hostname == "k-w2"
EOF

# BGP peer для k-w3
cat << EOF > bgppeer-k-w3.yaml
apiVersion: projectcalico.org/v3
kind: BGPPeer
metadata:
  name: k-w3-to-switch
spec:
  peerIP: 10.3.33.0
  asNumber: 65013
  nodeSelector: kubernetes.io/hostname == "k-w3"
EOF

# Применяем все BGP peers
calicoctl apply -f bgppeer-k-w1.yaml
calicoctl apply -f bgppeer-k-w2.yaml
calicoctl apply -f bgppeer-k-w3.yaml
Check that all peers exist:
user@K-Master:~$ calicoctl get bgppeer
NAME                 PEERIP      NODE                                   ASN
k-master-to-switch   10.0.11.0   kubernetes.io/hostname == "k-master"   65011
k-w1-to-switch       10.1.11.0   kubernetes.io/hostname == "k-w1"       65011
k-w2-to-switch       10.2.22.0   kubernetes.io/hostname == "k-w2"       65012
k-w3-to-switch       10.3.33.0   kubernetes.io/hostname == "k-w3"       65013
All sessions came up on the switches:
Leaf-1#show ip bgp su

  Neighbor  V AS           MsgRcvd   MsgSent  InQ OutQ  Up/Down State   PfxRcd PfxAcc
  10.0.11.1 4 65000            220       635    0    0 02:55:10 Estab   32     32
  10.1.11.1 4 65001             22       503    0    0 00:02:56 Estab   32     32


Leaf-2#show ip bgp summary

  Neighbor  V AS           MsgRcvd   MsgSent  InQ OutQ  Up/Down State   PfxRcd PfxAcc
  10.2.22.1 4 65002             30       497    0    0 00:05:37 Estab   39     39

Leaf-3#show ip bgp summary

  Neighbor  V AS           MsgRcvd   MsgSent  InQ OutQ  Up/Down State   PfxRcd PfxAcc
  10.3.33.1 4 65003             30       496    0    0 00:05:53 Estab   39     39
But we’re still getting a ton of extra stuff — we need to dismantle the full-mesh.
Dismantling the Full-Mesh and Disabling Tunnel Mode
We patch our pool, disabling IPIP tunnels there:
kubectl patch ippool new-wonderful-pool --type='merge' -p='{"spec":{"ipipMode":"Never"}}'
and NAT:
kubectl patch ippool new-wonderful-pool --type='merge' -p='{"spec":{"natOutgoing":false}}'
We restart the calico-nodes via a rollout:
user@K-Master:~$ kubectl rollout restart daemonset/calico-node -n kube-system
daemonset.apps/calico-node restarted
user@K-Master:~$ kubectl rollout status daemonset/calico-node -n kube-system
Waiting for daemon set "calico-node" rollout to finish: 1 out of 4 new pods have been updated...
Waiting for daemon set "calico-node" rollout to finish: 1 out of 4 new pods have been updated...
Waiting for daemon set "calico-node" rollout to finish: 2 out of 4 new pods have been updated...
Waiting for daemon set "calico-node" rollout to finish: 2 out of 4 new pods have been updated...
Waiting for daemon set "calico-node" rollout to finish: 3 out of 4 new pods have been updated...
Waiting for daemon set "calico-node" rollout to finish: 3 out of 4 new pods have been updated...
Waiting for daemon set "calico-node" rollout to finish: 3 of 4 updated pods are available...
daemon set "calico-node" successfully rolled out
While the nodes were restarting, I started a ping from the client to 10.66.111.1; a couple of packets were lost:
64 bytes from 10.66.111.1: icmp_seq=54 ttl=60 time=12.2 ms
64 bytes from 10.66.111.1: icmp_seq=55 ttl=60 time=11.5 ms
64 bytes from 10.66.111.1: icmp_seq=56 ttl=60 time=13.2 ms
From 10.4.44.0 icmp_seq=57 Destination Net Unreachable
From 10.4.44.0 icmp_seq=58 Destination Net Unreachable
From 10.4.44.0 icmp_seq=59 Destination Net Unreachable
From 10.4.44.0 icmp_seq=60 Destination Net Unreachable
From 10.4.44.0 icmp_seq=61 Destination Net Unreachable
64 bytes from 10.66.111.1: icmp_seq=62 ttl=60 time=13.7 ms
64 bytes from 10.66.111.1: icmp_seq=63 ttl=60 time=14.0 ms
And to dismantle the full-mesh BGP, we need to patch our BGPConfig, and the full mesh should disappear:
user@K-Master:~$ calicoctl patch bgpconfig default --patch='{"spec":{"nodeToNodeMeshEnabled":false}}'
Successfully patched 1 'BGPConfiguration' resource

user@K-Master:~$ sudo calicoctl node status
Calico process is running.

IPv4 BGP status
+--------------+---------------+-------+----------+-------------+
| PEER ADDRESS |   PEER TYPE   | STATE |  SINCE   |    INFO     |
+--------------+---------------+-------+----------+-------------+
| 10.0.11.0    | node specific | up    | 08:50:34 | Established |
+--------------+---------------+-------+----------+-------------+

* And an example from another node:

user@k-w1:~$ sudo calicoctl node status
Calico process is running.

IPv4 BGP status
+--------------+---------------+-------+----------+-------------+
| PEER ADDRESS |   PEER TYPE   | STATE |  SINCE   |    INFO     |
+--------------+---------------+-------+----------+-------------+
| 10.1.11.0    | node specific | up    | 09:03:20 | Established |
+--------------+---------------+-------+----------+-------------+
Now, from the switches’ perspective:
Leaf-1#show ip bgp su
BGP summary information for VRF default
Router identifier 10.11.99.1, local AS number 65011
Neighbor Status Codes: m - Under maintenance
  Neighbor  V AS           MsgRcvd   MsgSent  InQ OutQ  Up/Down State   PfxRcd PfxAcc
  10.0.11.1 4 65000            334       694    0    0 00:02:13 Estab   2      2
  10.1.11.1 4 65001            131       560    0    0 00:02:13 Estab   2      2
There are far fewer prefixes now—two. One for the pod network, another for the 10.96.0.0/12 network (Cluster Services).
From each leaf’s perspective, it has BGP routes to the pod networks of each node:
abap
Leaf-1#show ip ro bgp | inc /24
 B E      10.66.95.0/24 [200/0] via 10.1.11.1, Ethernet3
 B E      10.66.111.0/24 [200/0] via 10.0.11.1, Ethernet2

Leaf-2#show ip ro bgp | inc /24
 B E      10.66.217.0/24 [200/0] via 10.2.22.1, Ethernet2

Leaf-3#show ip ro bgp | inc /24
 B E      10.66.52.0/24 [200/0] via 10.3.33.1, Ethernet2
And this is exactly what we needed!
A couple of final checks:
Curl works from the outside:
user@ubuntu:~$ curl -s http://10.66.111.2
<!DOCTYPE html>
<html>
<head>
<title>Welcome to nginx!</title>
And it’s accessible from another pod:
user@k-w2:~$ kubectl run test-pod2 --image=alpine --restart=Never --rm -it -- sh
If you don't see a command prompt, try pressing enter.

/ # curl -s http://10.66.111.2
sh: curl: not found

/ # wget http://10.66.111.2 -S
Connecting to 10.66.111.2 (10.66.111.2:80)
  HTTP/1.1 200 OK
  Server: nginx/1.29.1
  Date: Fri, 22 Aug 2025 09:11:48 GMT
  Content-Type: text/html
  Content-Length: 615
  Last-Modified: Wed, 13 Aug 2025 15:10:23 GMT
  Connection: close
  ETag: "689caadf-267"
  Accept-Ranges: bytes

saving to 'index.html'
index.html           100% |*****************************************************************************************|   615  0:00:00 ETA
'index.html' saved
Conclusion
And just like that, in a couple of minutes, we figured out how to make a flat, routable network in Kube )